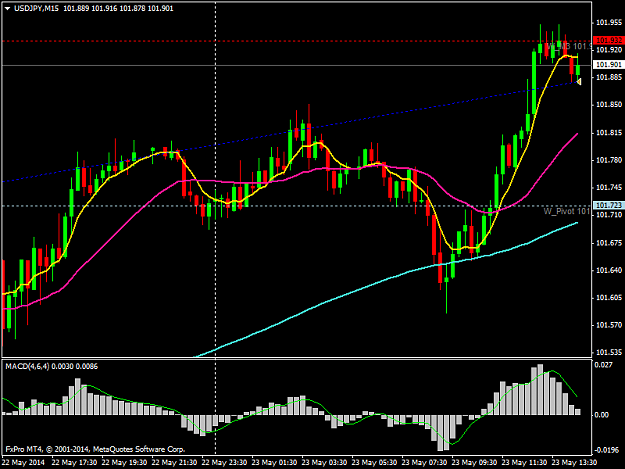
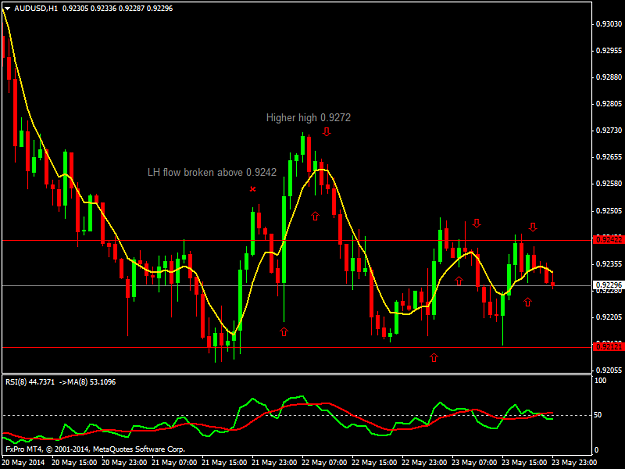
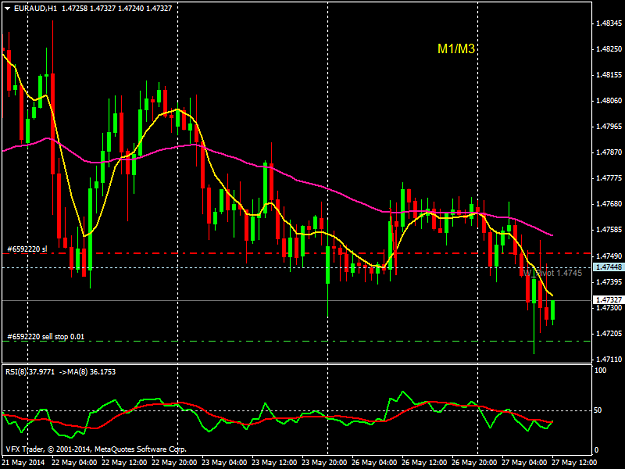
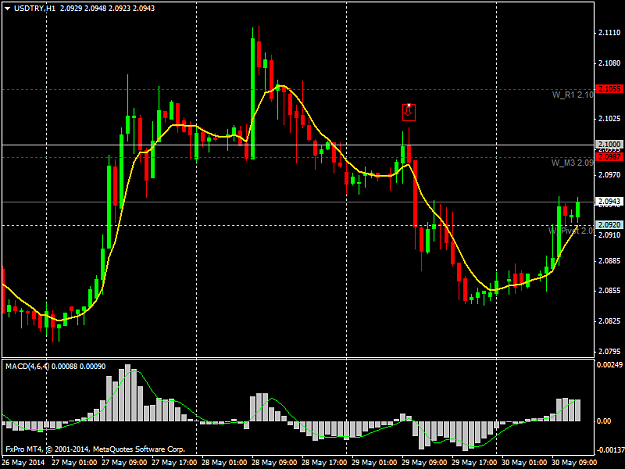
Disliked{quote} One of my kind of friends/unofficial mentorees asked me to look at eur and comment with the D lower wicks and ask about the possible sell on move down. Why would this be a sell and uj was a buy with lower wicks. For me it comes down to flow. UJ after the D hammer/pin on 21st May had a hl in Asian session on 22nd, a 1hr positive close 3 bar reversal, the hl's continued going into US session. EUR's D hammers on 15th and 21st were followed by a neg D close and 1hr flow down. See the 1hr chart what we are trying to suggest is a trade, why 'cherry...Ignored
Did some typo changes to improve this post.
This is general comment from 1st post to confirm the above:
General
Some knowledge of candlestick analysis is required as you want to be trading the right candles. Theres only about 5 to watch for. If I had to give 1 simple rule of thumb it would be engulfing close (particularly engulfing the last 2 candle closes, see the reversal 3 bar alert attached). Consider key levels for turns (eg round numbers, D and W pivots, some fibs, S/R areas), are we above below 1hr 8 lwma (see chart below should be obvious why) is the 1hr itself on a hl/lh as the higher high higher low or lower high lower low flow is crucial. Once set up on 1hr price should move a pip or so (+ spread on buys) beyond the high low of the set up candle to confirm the trade. The set up candle should have little/no wick in direction of trade eg if buying little/no upper wick.