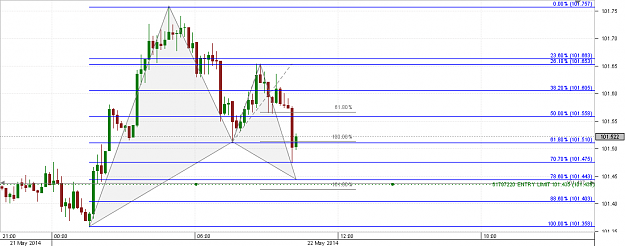
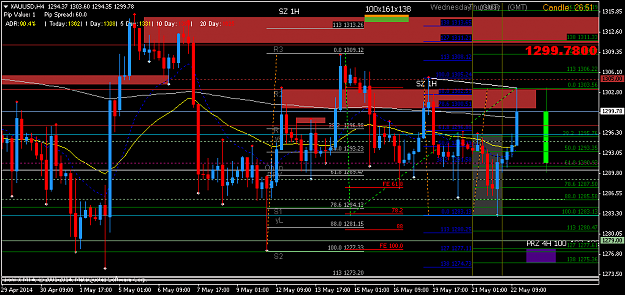
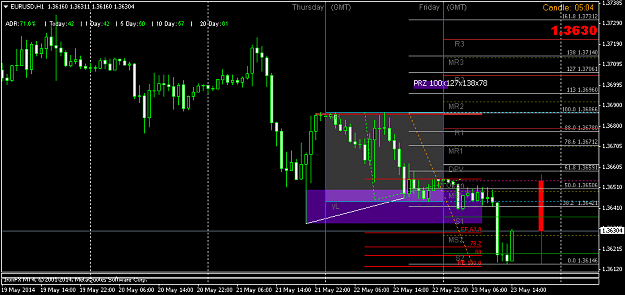
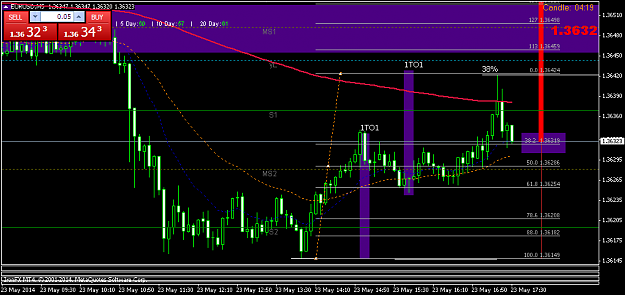
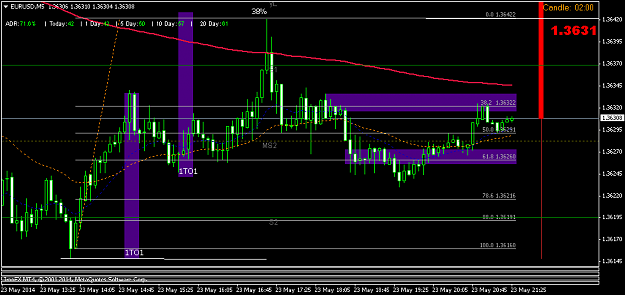
I am looking to break into long up to 61%. regards {image} {image}
Ignored
Target posted yesterday, I reached today,
Too bad, he did not touch my entry for a few pips, would not have to sleep, not to miss anything.
Once again, we can see, and from the PRZ, the price shoots out, and along the way makes a beautiful 1TO1. As can be seen in the 30 M TF.
Greetings.
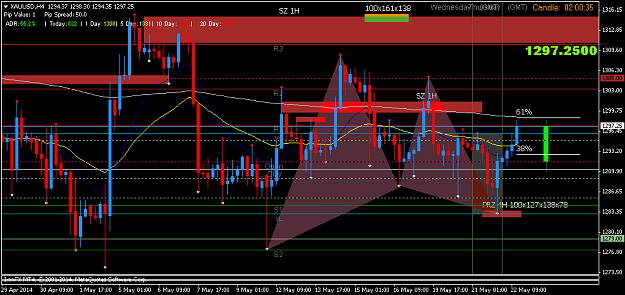
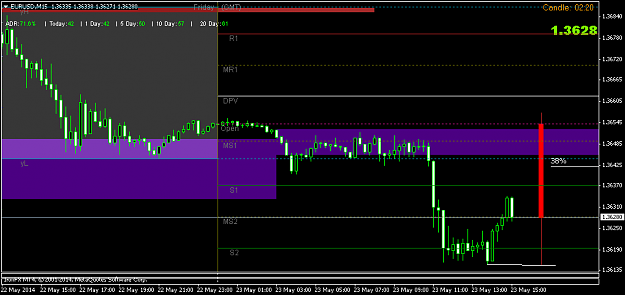
SZ controls, strong resistance Mayor, VERMOS if the price reacts to that level, if we're accepted long, unlikely, if it is rejected at that level, we are racing, very probable.
Our expectation is Kick to PRZ as ratios.
We look forward to the development of the day.
regards
Different Luck, EURUSD - 10 pips, GBPUSD, reached 38 and + 17 pips, lots of patience, poor market conditions, trying to lighten the shadows.
Sometimes I give myself a fright, Greetings
{quote} Hey Pampaq, I like the way you're looking at this. Should be a good trade!
Ignored
Thank you my friend, however you always walk with great caution, the market does what it wants, and we should read us.
When we hit, we read it correctly. When we fail, we read wrong.
In the case of ERUUSD the mmtum was clearly bearish, so we should have hesitated, I was not ready for reversal. Not reached, at least 38.
NOW is a 1TO1, and very pro0babilidad, long may take up to 38.
We'll see.
I aim SOMETHING VERY IMPORTANT that Mr Pips taught us ALWAYS HAVE AN EXPECTATION, why?, because, if not met there to leave immediately.
If is true, leave the profits run.
The only way to do that is by having clear our trading plan.
Greetings, thanks and forgiveness.
{quote} Thank you my friend, however you always walk with great caution, the market does what it wants, and we should read us. When we hit, we read it correctly. When we fail, we read wrong. In the case of ERUUSD the mmtum was clearly bearish, so we should have hesitated, I was not ready for reversal. Not reached, at least 38. NOW is a 1TO1, and very pro0babilidad, long may take up to 38. We'll see. I aim SOMETHING VERY IMPORTANT that Mr Pips taught us ALWAYS HAVE AN EXPECTATION, why?, because, if not met there to leave immediately. If is true,...
Ignored
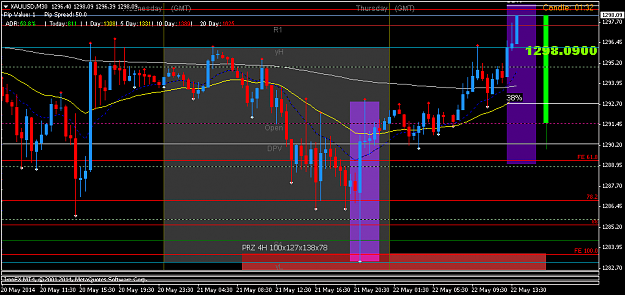
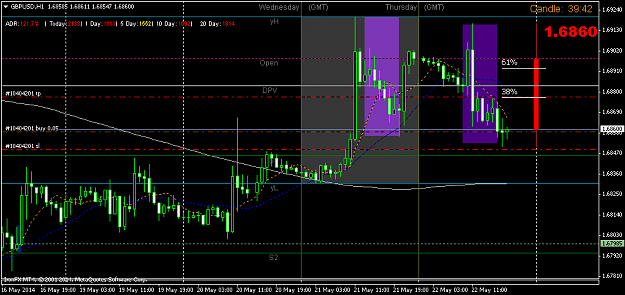
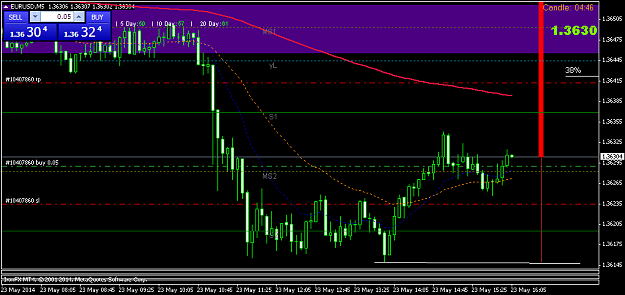
Control, waiting for a pull back, and evaluation of strength and weakness, to go long up to 38%.
regards,
{quote} In resistance, high pivot, if it breaks, we continue, but if it does not break up, we close the position. better, few pips, that nothing pips.
Ignored
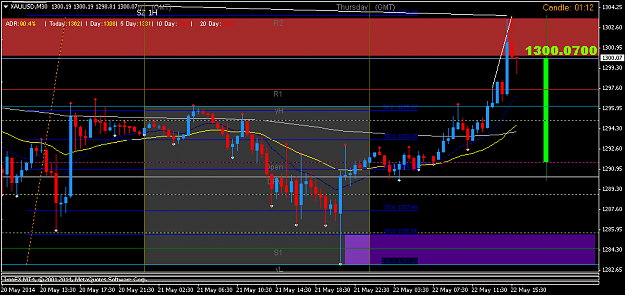
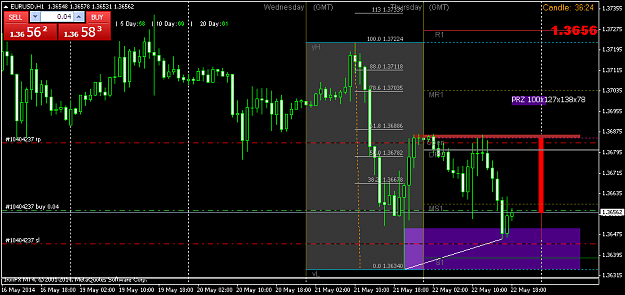
TP reached, +14 pips. The market is very slow, even slower without news.
We must control mmtum, strength and weakness to see if we follow the 61%.
regards
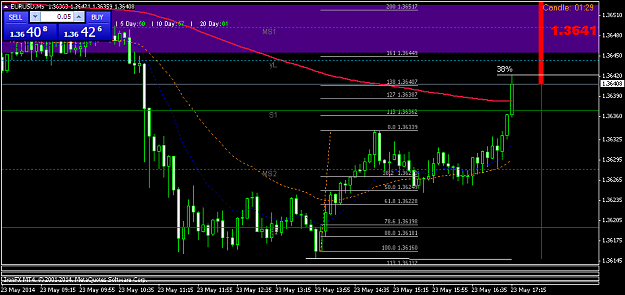
another example of! TO1, and its 38%
{quote} TP reached, +14 pips. The market is very slow, even slower without news. We must control mmtum, strength and weakness to see if we follow the 61%. regards another example of! TO1, and its 38% {image}
Ignored
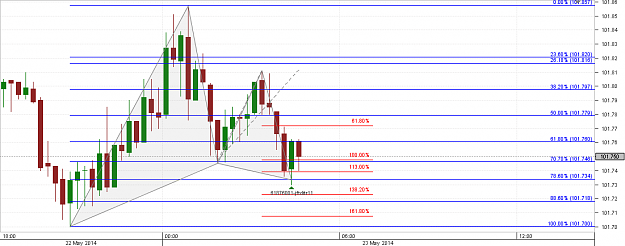
We see the market, and learn that there bearish mmtum comparing the time it took to get to 38 and upward, the time taken to reach 38 bearish.
all data is important, made a bullish 1TO1 and now 1TO1 bearish.
regards
{quote} We see the market, and learn that there bearish mmtum comparing the time it took to get to 38 and upward, the time taken to reach 38 bearish. all data is important, made a bullish 1TO1 and now 1TO1 bearish. regards {image}
Ignored
reaching 61%, ie on a day that the pair moved, 40pips is possible with this technique to capture 14 pips up and 14 pips down 28 pips, 70% of the course of the day.
The rest is a matter of lot size.
Greetings. great weekend.
{quote} reaching 61%, ie on a day that the pair moved, 40pips is possible with this technique to capture 14 pips up and 14 pips down 28 pips, 70% of the course of the day. The rest is a matter of lot size. Greetings. great weekend. {image}
Ignored
Good Job. Dude, I would be pretty happy with 40 pips a day.
Hello fellow trades. I was looking to get some insight on a particular trade I took May 16, 2014. -My overall bias was Bearish with the long term trend trending Down (not shown). -Price made a Double AB=CD move into strong structure and Round Number (1.8300). (one big AB=CD followed by a confirming smaller AB=CD, marked kill Zone in the first Green Box) -I entered short after conpletion on the confirming bearish bar circled on the chart. Even though Price looked to be gaining momentum, I seen that the two bars respected the 1.83 level and was confident...
Ignored
Hi Mack a couple of points there for me, first , (all with hindsight of course) because price made a hh that would have made me a bit more hesitant on opening a trade there initially, and I would have liked to have seen more exhaustion round your 8300 level and in that initial approach.. it didnt really show that.. you did have a bit of confluence there hence the initial bearish reaction that got you in, its hard to see on your chart but was there decent structure to the left? so with the hh and no real exhaustion I would prob would have liked to have seen those hhs taken out around 8290, thats structure right there and quite close to ur entry , also price tried to drop next bar after the down bar in your circle and your price confirmation for short, then rallied quite strongly a big indication for me price was gonna go higher, which to your stop question would have had me close that short
Never said I was Batman,all I'm saying is you'll never see us together.
{quote} Hi Mack a couple of points there for me, first , (all with hindsight of course) because price made a hh that would have made me a bit more hesitant on opening a trade there initially, and I would have liked to have seen more exhaustion round your 8300 level and in that initial approach.. it didnt really show that.. you did have a bit of confluence there hence the initial bearish reaction that got you in, its hard to see on your chart but was there decent structure to the left? so with the hh and no real exhaustion I would prob would have...
Ignored
Thank you for your response Headfake. I really struggled with this post trade review. I wanted to make sure I understood it correctly.
Yeah, there was decent structure. It started with a consolidation period on a large swing then was tested twice with strong rejection. The next area of supply was quit close, just above.
Now looking back at it, you’re right. The momentum was to strong. The long range bar with a small body should have been a clue that there was high volatility in price action lowering the probability of success in gauging either direction. I think I was faked out when the long ranged bar closed below the 1.8300 handle. Also the deep projection creating a HH, as you mentioned, was definitely a clue.
Just so we are clear, you would have closed out the position on the candle close at market on the candle flagged with a blue arrow? I think you’re right again. If I didn’t close there, I should of definitely closed on the next candle, which showed no intrest of moving below the 1.8300 handle.
I've been struggling with the issue of where to place stops. Should I close on confirmation failure or give it room to breathe? I'm sort of leaning to confirmation failure.... Do you have any rule sets on stop placement....? (If you don't mind me asking).