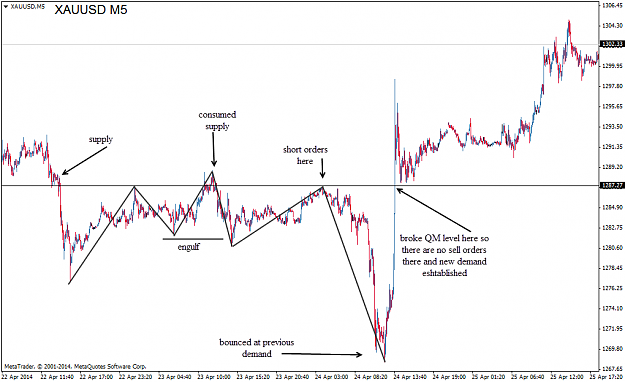
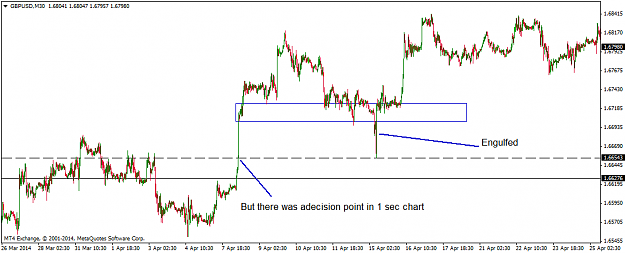
Trading H4 on GBPUSD this was my reasoning: {image} Former Demand level broken and lower low. Price can go lower to the origin of the big up candle after price retraces. Does that make any sense?
Ignored
I have this exact trade cooking right now. Short from 6829. This style of trading isn't the same as the flag limit trades that people have been doing, but it is one of my main ways of trading the bigger time frames. The lower time frames have now followed suite and will drag the H4 with it. Hold the trade until a valid supply zone is broken above. Otherwise... follow the rabbit down the hill.
The market will never take a direction without first going to close orders that banks and ratail have opened for the 90%.
In this situation, you've done well to get short because as you can see from the image the yellow rectangle that represents the level that needs to be closed as it was.
and if you can see those before you will notice that they always closes exactly on the minimum or maximum in this situation the GBP-USD
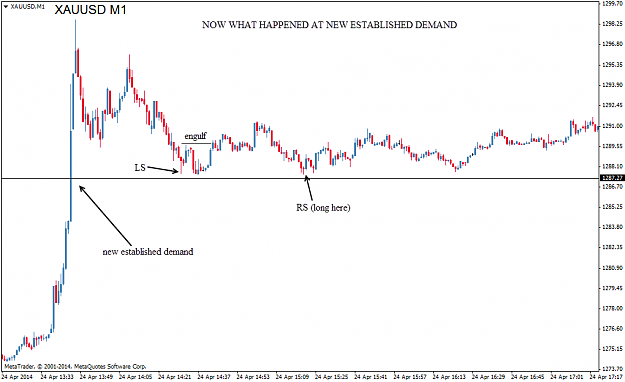
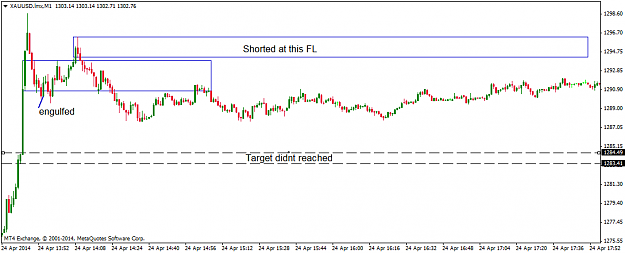
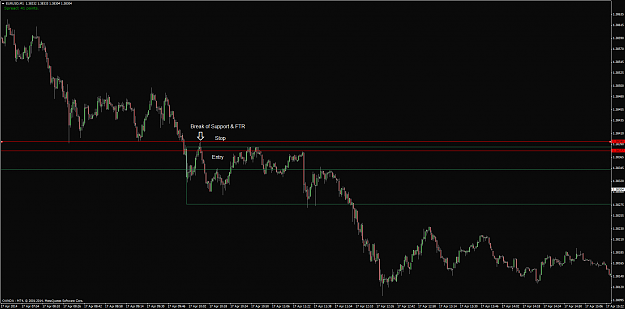
Hi IF, this is a failure trade. Short didnt reached next FL . Price blown to the north.
Any mistakes i have done?. Anyone can comment. I believe this method is powerful if we discuss more failed trades.
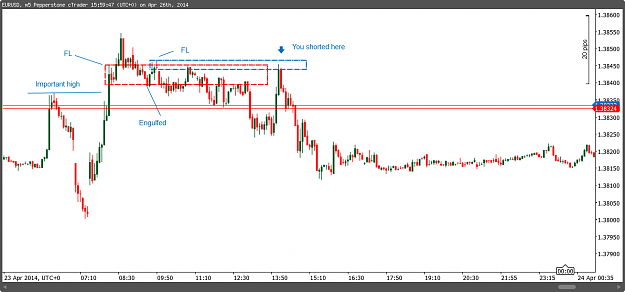
Hi IF, this is a failure trade. Short didnt reached next FL . Price blown to the north. Any mistakes i have done?. Anyone can comment. I believe this method is powerful if we discuss more failed trades. {image}
Hi IF, this is a failure trade. Short didnt reached next FL . Price blown to the north. Any mistakes i have done?. Anyone can comment. I believe this method is powerful if we discuss more failed trades. {image}
Ignored
I agree, we learn much more on mistakes than on successes. The explanation by IF and Kuma are great. Thanks guys.
MQL5 Market products 10 times cheaper? Yes, we can help. Send us a PM
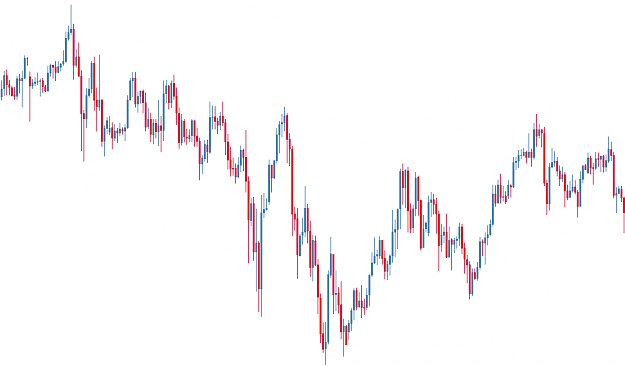
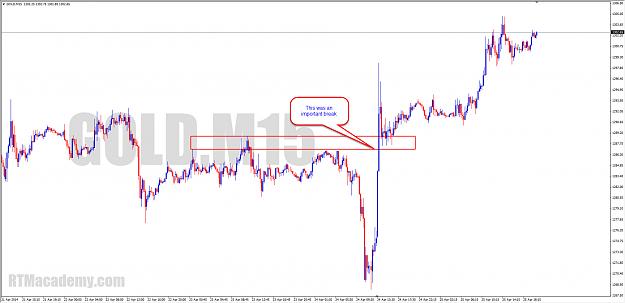
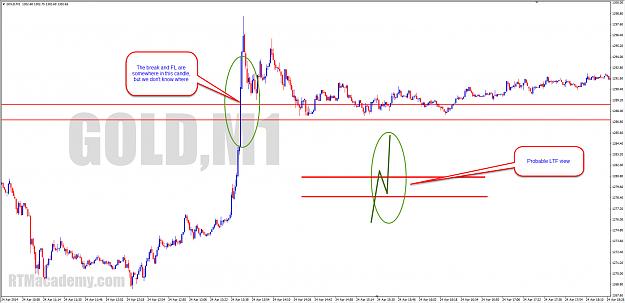
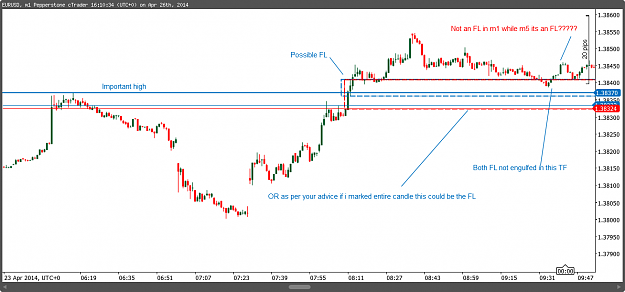
The M1 chart doesn't always show us the exact PA which occurred. That's why we so often need to treat an entire M1 candle as a possible FL. {image} {image}
Ignored
Thanks IF
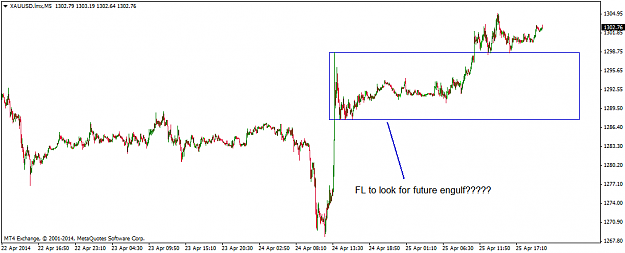
I was thinking about this before also. Marking FL often is a problem for me. Now if i took m5 chart, i would have marked the FL like this.
Attached Image (click to enlarge)
Last time when i digged GU chart, i found an engulf . But examining 1 second chart , i found a decision point .
Attached Image (click to enlarge)
It more look like FL is function of TF. But in reality it shouldn't be like that as time charts are data packed charts. Its not real . Only real chart is tick chart we all know that.How we can overcome this problem?. How we get rid of time based FL illusion?.
This often confuses.Can you shed some light on this?. I believe it should be helpful to all the readers here.
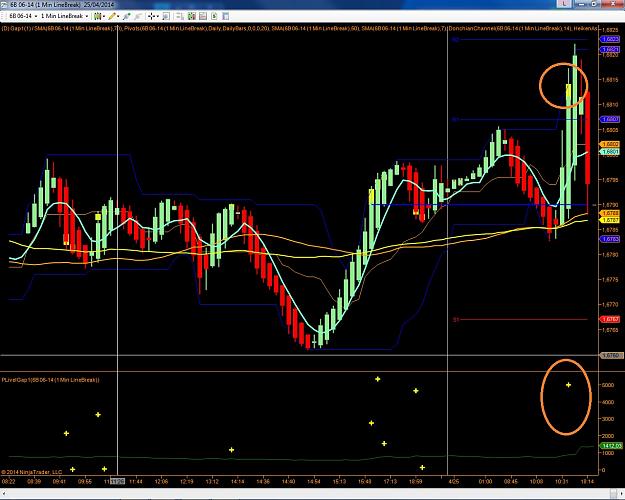
{quote} I tried to find reasons why the trade was failed. {image} {image}
Ignored
Kumaramy mate,
Thanks for your reply.Over these years reading IF posts, i found he has evolved in so many ideas he introduced before. This supply became demand and decision point is pretty old fashioned in his recent posts. You can see that clearly. When supply engulfed it creates FTR/Hook in lower TF when price returns here it reacts. People say supply became demand. same thing goes to SR flip too. His all concepts is now revolving around FTR or FL. In my studies i also found the same.
Anyway this is my guess only. IF is the best person to answer this.
{quote} Thanks IF I was thinking about this before also. Marking FL often is a problem for me. Now if i took m5 chart, i would have marked the FL like this. {image} Last time when i digged GU chart, i found an engulf . But examining 1 second chart , i found a decision point . {image} It more look like FL is function of TF. But in reality it shouldn't be like that as time charts are data packed charts. Its not real . Only real chart is tick chart we all know that.How we can overcome this problem?. How we get rid of time based FL illusion?. This often...
Ignored
First of all, we need to understand that time has no place in any read of the market.
The only way to be completely sure of where a FL is, is to be there when the break occurs, and mark the highs and lows as they occur. Within a minute they can be obscured by a candle, but we'll know exactly where they are. If we're not there to watch and mark, we must use the full candle as a FL
{quote} First of all, we need to understand that time has no place in any read of the market. The only way to be completely sure of where a FL is, is to be there when the break occurs, and mark the highs and lows as they occur. Within a minute they can be obscured by a candle, but we'll know exactly where they are. If we're not there to watch and mark, we must use the full candle as a FL
Ignored
Hi IF, please see if my statement is correct as what i understand from what you said:
If we trade M1, we would not know where is FL zone unless we mark it there when it happen but if we trading higher TF for instance M15, we can often refer to M1 to find the zone of FL.
{quote} First of all, we need to understand that time has no place in any read of the market. The only way to be completely sure of where a FL is, is to be there when the break occurs, and mark the highs and lows as they occur. Within a minute they can be obscured by a candle, but we'll know exactly where they are. If we're not there to watch and mark, we must use the full candle as a FL
Ignored
Not that sure i put it correctly. I have taken your previous trade on m5 and marked the zone that u traded. Looked fine everything was ok.
Attached Image (click to enlarge)
Then i went to m1 , Whole story changed. m1 FL not engulfed and m5 FL is not the FL in this TF.See below.
{quote} Not that sure i put it correctly. I have taken your previous trade on m5 and marked the zone that u traded. Looked fine everything was ok. {image} Then i went to m1 , Whole story changed. m1 FL not engulfed and m5 FL is not the FL in this TF.See below. {image}
Ignored
I think you're probably overthinking it. Stick with the one time frame for picking the engulf and the entry zone. Maybe someone else would like to add on or give better advice, though.
{quote} I think you're probably overthinking it. Stick with the one time frame for picking the engulf and the entry zone. Maybe someone else would like to add on or give better advice, though.
Ignored
Im afraid i can't agree with this even the same thing has said by the thread starter also . I already mentioned TF is illusion.its data packed. trading is instant.it happens in this moment not hourly or daily basis.when i say i trade 1 hr , that simply means i ignore whatever took place within hour as 1 hr data feed packed inside the candle. but to see overall picture u need to look HTF as u cant zoom out LTF charts that much.More LTF u go you are close to the truth. Thats how IF catches HTF moves with the zero drawdown entry.
{quote} Hi IF, please see if my statement is correct as what i understand from what you said: If we trade M1, we would not know where is FL zone unless we mark it there when it happen but if we trading higher TF for instance M15, we can often refer to M1 to find the zone of FL.
Ignored
Even a weekly move can hinge on a FL invisible in the M1
{quote} I think you're probably overthinking it. Stick with the one time frame for picking the engulf and the entry zone. Maybe someone else would like to add on or give better advice, though.
Ignored
Timeframe has nothing to do with PA - only the engulfs of FLs of greater and lesser importance
{quote} Timeframe has nothing to do with PA - only the engulfs of FLs of greater and lesser importance
Ignored
Maybe that's the issue then, prioritizing what really is of greater and lesser importance. I just find that I'm not the best judge of that - and like FxYogi, I find contradictions in my mind as to whether or not an important area has actually been engulfed or not when you see a 1 minute zone right below where you thougth a 5 minute flag limit was cleared. I'm sure you've covered this before, I'll have to take a look through the forum later.
Joined Nov 2012
|
Status: Account Deactivated
|2,737 Posts
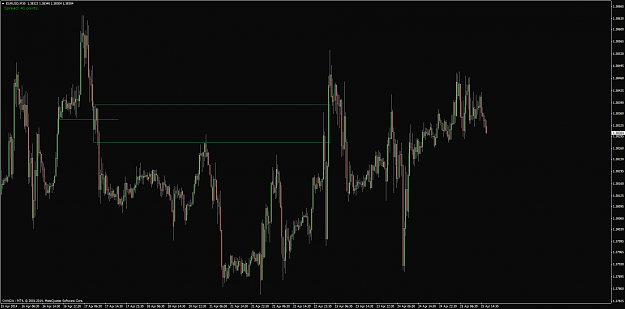
Maybe this is what you're talking about. In the M30 I've identified what I thought was an FTR - we had a break of the flag into the LQG and the creation of a new one. Looking down at the lower minute frame I see that we had a very tiny little zone show up that would be considered another FTR. When price reached it, that became the reversal point. Am I understanding correctly?
I have hide pair name ..TF and other details. Only PA is displayed. Still you can analyze price action and make predictions. That means TF is nothing to do with PA as IF said.
Maybe this is what you're talking about. In the M30 I've identified what I thought was an FTR - we had a break of the flag into the LQG and the creation of a new one. Looking down at the lower minute frame I see that we had a very tiny little zone show up that would be considered another FTR. When price reached it, that became the reversal point. Am I understanding correctly?{image}{image}
Ignored
Exactly that's how i enter using the hook(FTR in RTM). but when the pic changes when i change the TF , engulfing scenario also changes