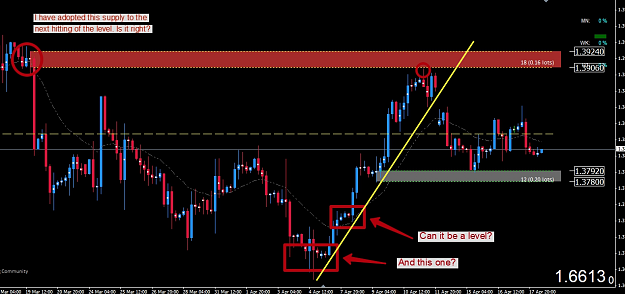
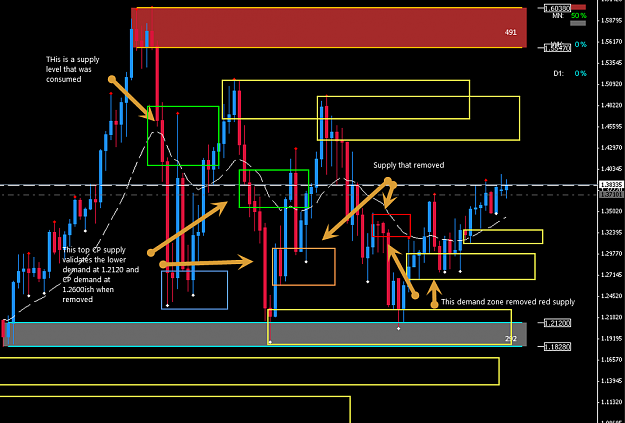
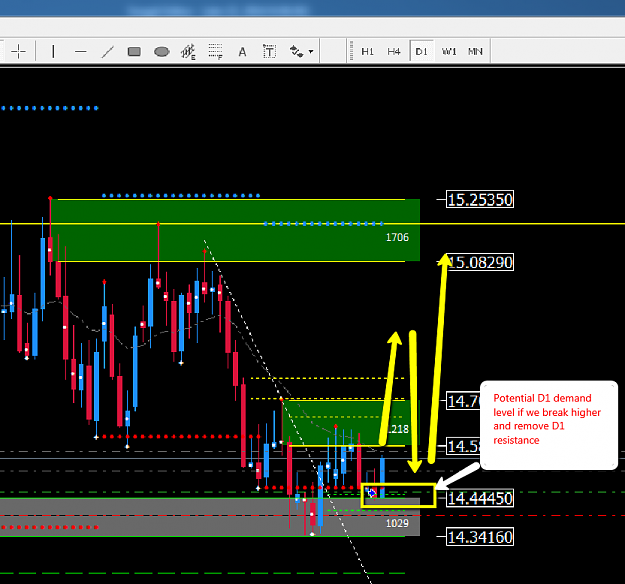
hi alfonso,
I'm trying to draw SnD level on D1 chart. Would you like to correct my SnD drawing? Thanks
here the chart..
Thanks,
Soni
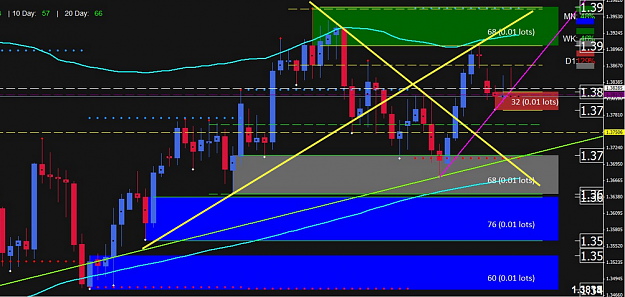
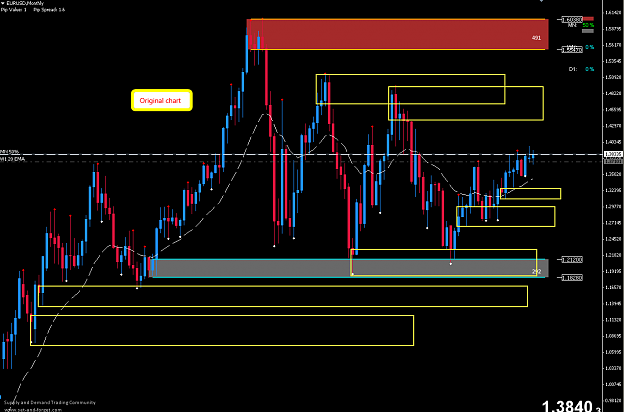
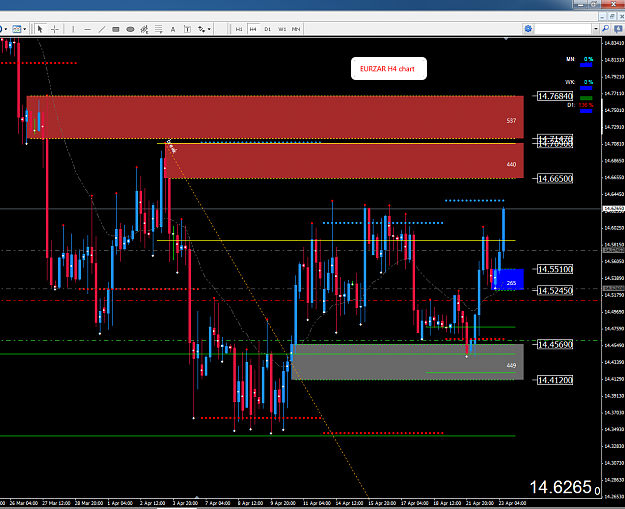
I'm trying to draw SnD level on D1 chart. Would you like to correct my SnD drawing? Thanks
here the chart..
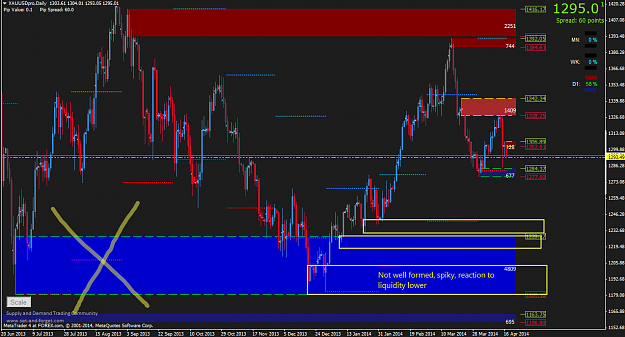
Attached Image (click to enlarge)
Thanks,
Soni