Have been away from the forum for a month, been struggling a bit. Thought some time alone would help - it didn't! Although March didn't suck too bad, I only took four trades - 2 BE's. one 13pips profit and one 49 loss. Riding low this month, but not worrying too much. The important thing is that I'm still at it I'll get there. Glad to come back in time to catch Mike's video on boxes and exits - fantastic stuff. Thank you Mike, really got some light bulbs flashing. Outstanding for you to take the time to do this stuff. Something has started to...
Ignored
Hey B
Good to see you and thanks for the nice comments I'm glad it is helpful in some way.
For me gbp/usd might be considered a very minor break of resistance. For me and funny enough this is something I spoke about in my last webinar(not the one posted). That the way I use terminology like a break of a zone, vs a break of a breakout pattern is VERY different. I do this to be picky so that I understand the situation better(from my style that is). For gbp/usd price never formed a pattern. It just found resistance within the larger consolidation(channel). So trading a break long is simply trading a minor pinbar in traffic into the last minor selling point. Now the problem I have with that isn't that price can't go higher. In fact I believe it probably would. It's that their is a lot of uncertainty that exists in this arae. Nothing major is occuring it's sort of price just dilly dallying a long. Then it becomes HOW will price get to where I want it to go. That's MORE important than price getting to where I want it to go eventually. Does that make sense? That's hugely important. These minor type areas often even when they get to where you want them can be a struggle in itself and that's why I avoid them.
Have been away from the forum for a month, been struggling a bit. Thought some time alone would help - it didn't! Although March didn't suck too bad, I only took four trades - 2 BE's. one 13pips profit and one 49 loss. Riding low this month, but not worrying too much. The important thing is that I'm still at it I'll get there.
Ignored
Hey Berserker,
I know exactly how you feel. I had to take several breaks from this forum and trading when things were not going so well. The thing I noticed is that every time I did come back I got better. And yes your correct the important thing is your still at it !
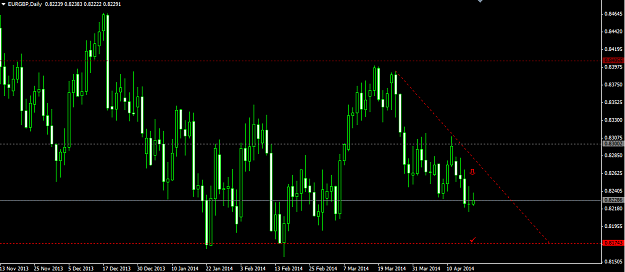
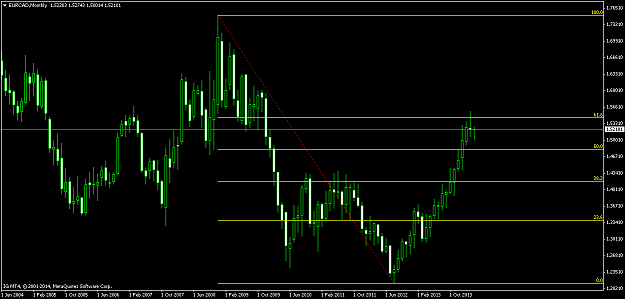
Hi guys, would you mind to share you views on this EURCAD Monthly chart, is this a pinbar? there is any kind of confluence in this retrace on the fib 61.8?
Sorry if this has been discussed before, this thread is huge, thanks in advance, all the best.
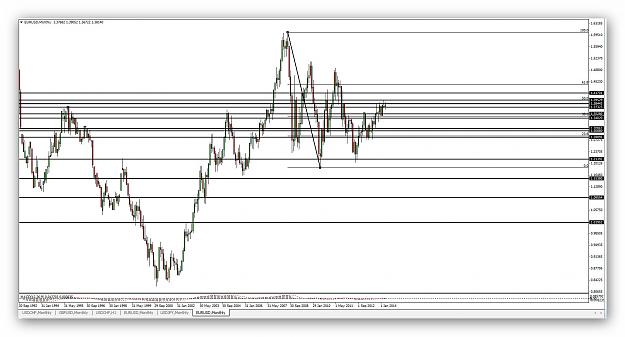
Hi guys, would you mind to share you views on this EURCAD Monthly chart, is this a pinbar? there is any kind of confluence in this retrace on the fib 61.8? Sorry if this has been discussed before, this thread is huge, thanks in advance, all the best. {image}
Ignored
Hi Rcubic,
I think this technically qualifies as a pin, because the close is within the previous period.
Apart from the above, I don't think this pin has got that much going for it.
- The bar is small, relative to the massive uptrend.
- The nose does not point away from current price as spectacularly as you'd want to see.
- The next period has broken out of this PB, rejecting 1.5 BRN so far.
- 1.5000 was a turn-off for entering, but even more for a potential late entry, seeing how price bounced away from it.
- Apart from the 61.8% fib retracement, you have the 1.5500 rejected, but again, 1.5 outweighs it's potential IMO.
{quote} Hi Rcubic, I think this technically qualifies as a pin, because the close is within the previous period. Apart from the above, I don't think this pin has got that much going for it. - The bar is small, relative to the massive uptrend. - The nose does not point away from current price as spectacularly as you'd want to see. - The next period has broken out of this PB, rejecting 1.5 BRN so far. - 1.5000 was a turn-off for entering, but even more for a potential late entry, seeing how price bounced away from it. - Apart from the 61.8% fib retracement,...
Ignored
Thanks for you response, it looks relative small to the uptrend, 1.5000 is a key level, thank you. Will continuo studying, and practicing. All the best.
{quote} Hey, This Pinbar is at a swing-low, thus having far less chance of succeeding. Seach for them at swing-highs. And just on a side-note, it's bank holiday throughout the whole market, so don't expect anything to happen before monday. (Edit): Where your red line is, would be a better location to look for PA.
Ignored
Swing low is a bad position for pin?
I think this is good pin which signal that price will be fall to monthly ppz.
Ok lets see.
Thanks Donaciello for Your opinion!
{quote} Thanks for you response, it looks relative small to the uptrend, 1.5000 is a key level, thank you. Will continuo studying, and practicing. All the best.
Ignored
Rcubic like Donaciello said the PB is small compared to to the move up and also sitting directly on the 1.5000 BRN. Look for very big bars for trend reversals.
{quote} Swing low is a bad position for pin? I think this is good pin which signal that price will be fall to monthly ppz. Ok lets see. Thanks Donaciello for Your opinion!
Ignored
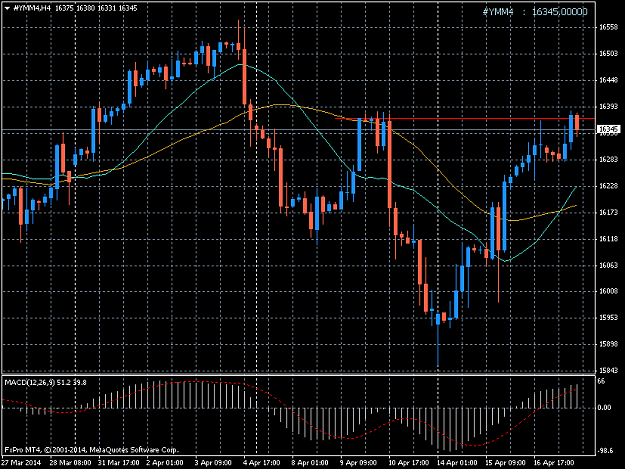
Forextm, your PB is not a PB technically as described in this thread as it should have a portion of its body outside the previous bar so that makes it an inside bar. Secondly going down there is traffic below the setup as well as momentum of the setup slowing down.
Hey Half and Almost I figured I would sort of answer you both together as well as upload a recent webinar of mine too. {quote} Well all kinds of setups happen and then you have periods when certain types don't. For example when price ranges as heavily as it has recently more likely I'll end up taking breakout type trades by the nature of the markets. Then when the markets break out and start swinging your chances of finding good swing type trades as you asked will appear. The market just goes through these cycles as well as individual pairs/securities...
Ignored
hi mr mike.
i watched your video. and some ligthning in my head. if i found all midpoint in monthly chart. it would help my trades.
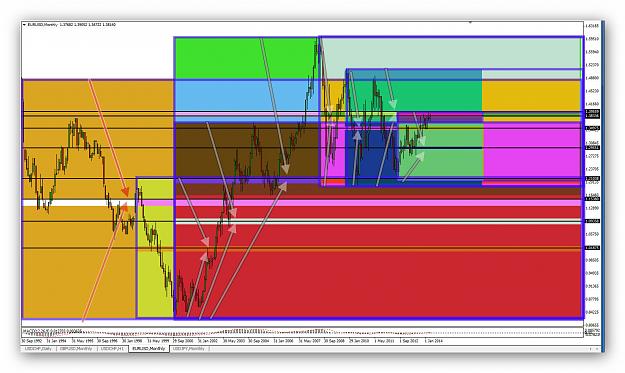
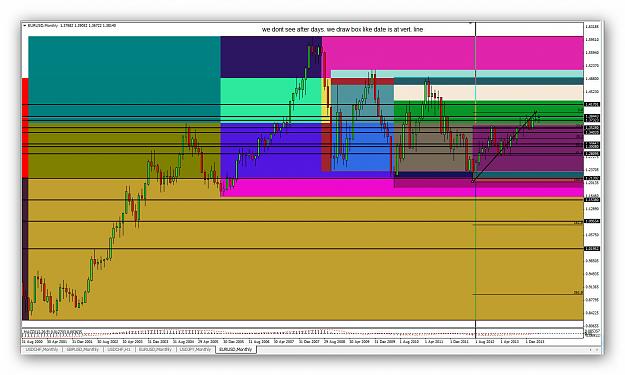
so i draw rectangles with horizontal lines that indicates midpoint of that rectangle.(arrows indicates which rectangle has which midpoint in chart) at the end of it i found 8 major levels for eur usd. (1.0187, 1.0935, 1,1538 etc.) i study price action historically and i see price respect those levels extremely.
Attached Image (click to enlarge)
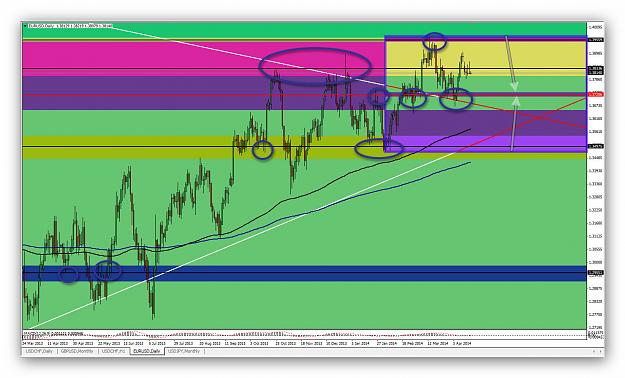
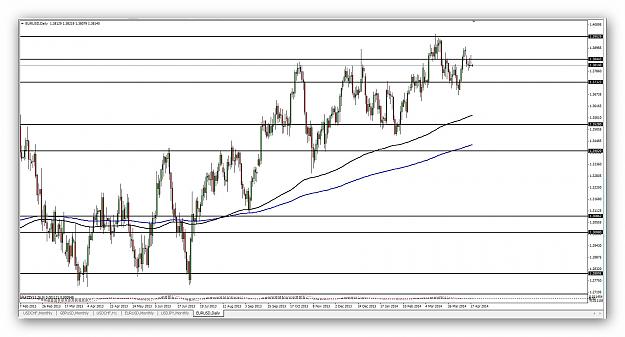
and lastly i draw last recent box for daily chart. so i can see range of price clearly. as a result i can follow price where will be reversal or continuation partterns will occur. i am appreciate to hear your opinions and advises. (sorry about my poor english and comlicated chart it is working stage)
Attached Image (click to enlarge)
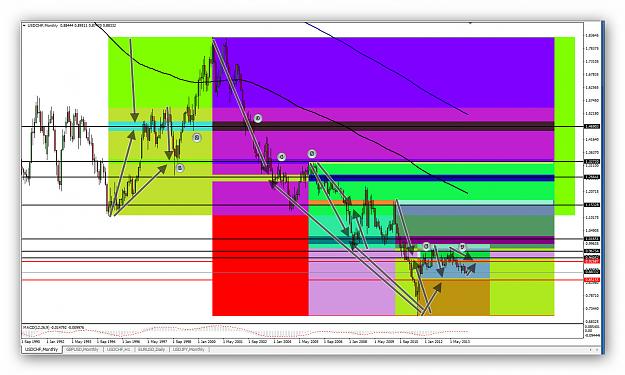
i did it for usd-chf too. and i realized that mid points are determined before swing lows or highs occur.
{quote} Forextm, your PB is not a PB technically as described in this thread as it should have a portion of its body outside the previous bar so that makes it an inside bar. Secondly going down there is traffic below the setup as well as momentum of the setup slowing down. {image}
{quote} hi mr mike. i watched your video. and some ligthning in my head. if i found all midpoint in monthly chart. it would help m..............t is working stage) i did it for usd-chf too. and i realized that mid points are determined before swing lows or highs occur.
Ignored
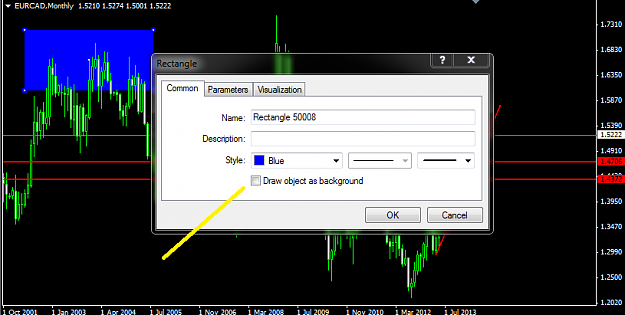
hey P could you please de-select the 'draw object as background' after you right click on the box so that it makes your chart easy for me and hopefully others to read as there are too many colors for me on the chart. Another thing about the midpoints, did you calculate them or did you draw them from boxes that occur on the monthly chart?
Thanks.
{quote} hey P could you please de-select the 'draw object as background' after you right click on the box so that it makes your chart easy for me and hopefully others to read as there are too many colors for me on the chart. Another thing about the midpoints, did you calculate them or did you draw them from boxes that occur on the monthly chart? Thanks. Al {image}
Ignored
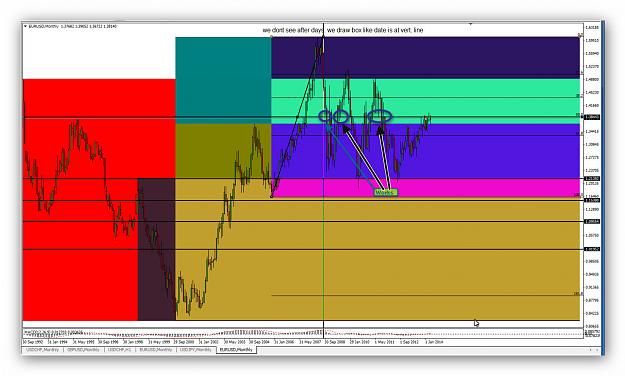
dear albus.
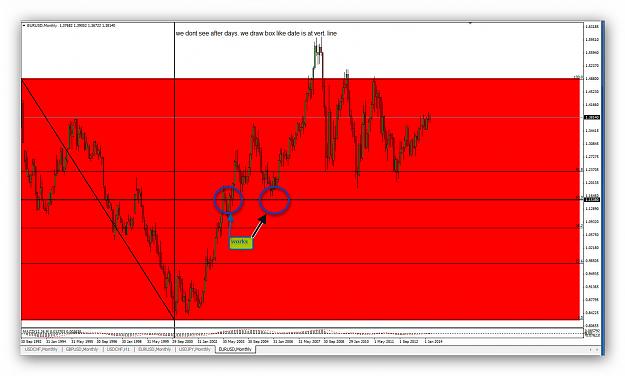
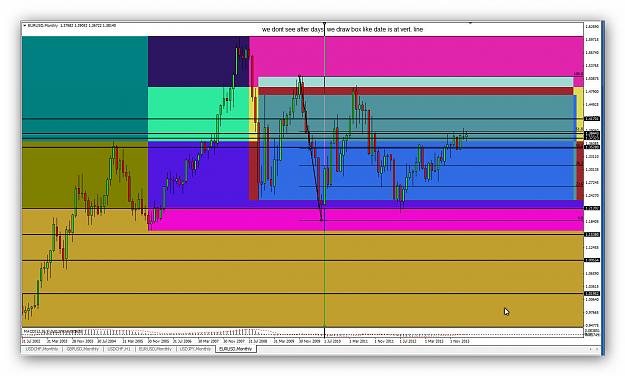
i draw rectangle from past to later days. lets do it step by step. i did all rectangles as bacgraound as you mentioned.
first rectangle coming from begining of chart. as if after days is not there yet.
first range we obtain 1.1538 midpoint first price touches works. 2nd touch works.
Attached Image (click to enlarge)
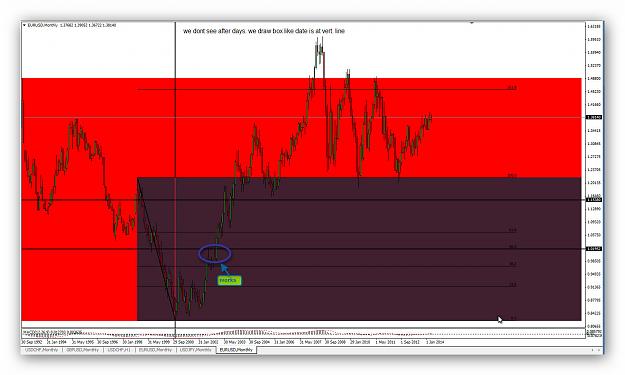
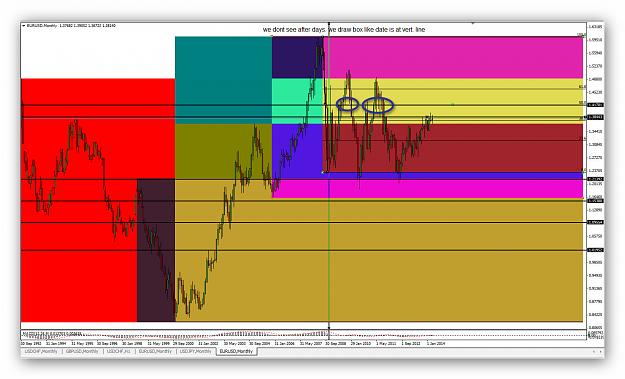
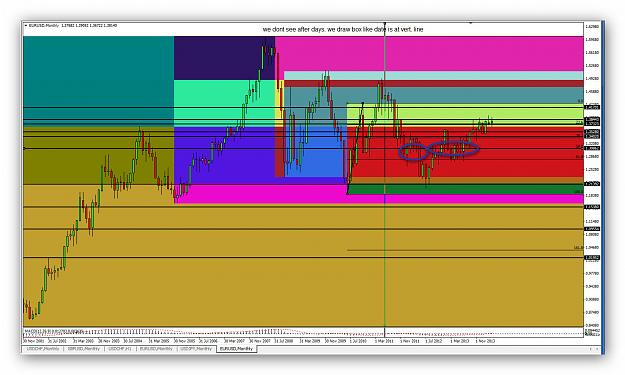
2nd range we obtain 1.0195 is our mid point. first price touches works.
Attached Image (click to enlarge)
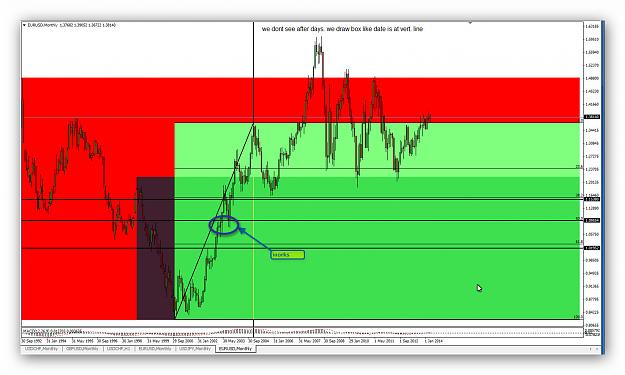
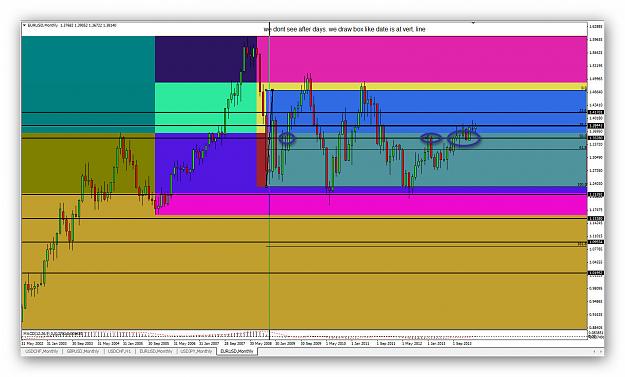
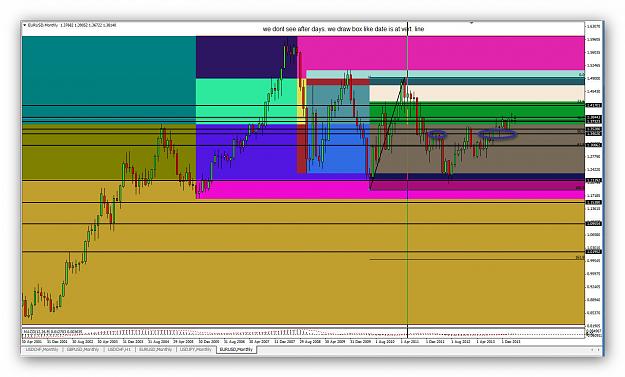
3th range we obtain 1.0955 is our mid point. first price touches works. continuation pattern occured.
Attached Image (click to enlarge)
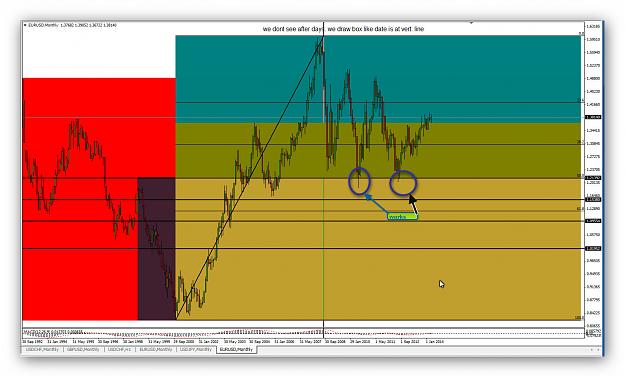
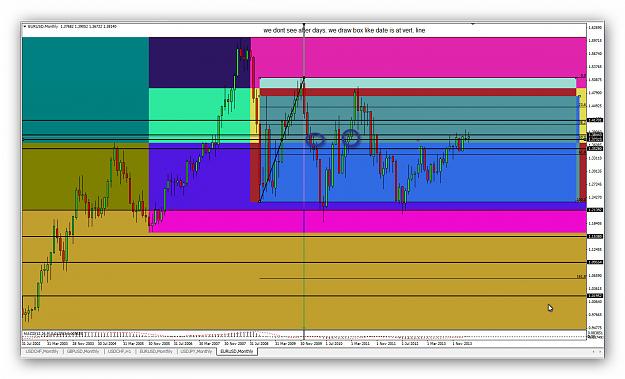
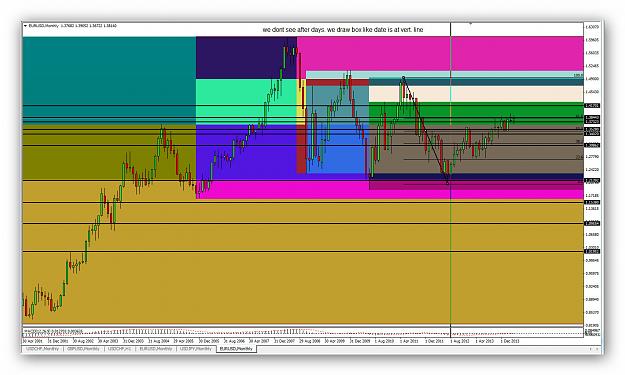
4th range we obtain 1.2139 is our mid point. first price touches works. 2nd touch works.
Attached Image (click to enlarge)
5th range we obtain 1.3844 is our mid point. multiple price touches works.
Attached Image (click to enlarge)
6th range we obtain 1.4170 is our mid point. multiple price touches works.
Attached Image (click to enlarge)
7th range we obtain 1.3528 is our mid point. multiple price touches works.
Attached Image (click to enlarge)
8th range we obtain 1.3732 is our mid point. multiple price touches works.
Attached Image (click to enlarge)
9th range we obtain nearly1.3528 is our mid point. so we didnt draw that hor. line.(note 1.3528 is more important than others because of 2 range's midpoint.)
Attached Image (click to enlarge)
10th range we obtain 1.3086 is our mid point. multiple price touches works.
{quote} dear albus. i draw rectangle from past to later days. lets do it step by step. i did all rectangles as bacgraound as you mentioned. first rectangle coming from begining of chart. as if after days is not there yet. first range we obtain 1.1538 midpoint first price touches works. 2nd touch works. {image} 2nd range we obtain 1.0195 is our mid point. first price touches works. {image} 3th range we obtain 1.0955 is our mid point. first price touches works. continuation pattern occured. {image} 4th range we obtain 1.2139 is our mid point. first...
Ignored
11th range we obtain 1.3400 is our mid point. multiple price touches works.
Attached Image (click to enlarge)
12th range we obtain nearly1.3528 is our mid point. so we didnt draw that hor. line.(note 1.3528 is more important than others because of 3 range's midpoint.)
Attached Image (click to enlarge)
13th range we obtain 1.2810 is our mid point. multiple price touches works.
Attached Image (click to enlarge)
and recent range we obtain 1.3000 is our mid point.
{quote} 11th range we obtain 1.3400 is our mid point. multiple price touches works. {image} 12th range we obtain nearly1.3528 is our mid point. so we didnt draw that hor. line.(note 1.3528 is more important than others because of 3 range's midpoint.) {image} 13th range we obtain 1.2810 is our mid point. multiple price touches works. {image} and recent range we obtain 1.3000 is our mid point. {image}
Ignored
as a result we have too many midpoint.(what expected decreased triangle pattern of e-u ) so we can delete some of them or use all of them.
i delete all rec. box and change my tf to daily. i decide to use this teqhnique because of suitable S&R levels.
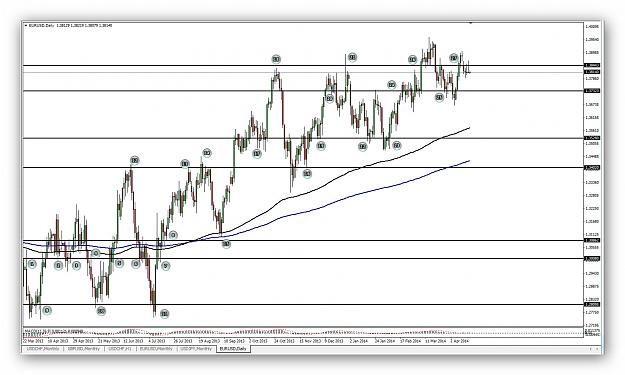
REMEMBER ALL HORIZONTAL LINES COMES FROM PAST. AND MARKET RESPECT THAT DIFFERENT MULTIPLE MIDPOINTS. we have all historical midpoints of this currency.
LOOK AT THIS GREAT DAILY OUTLOOK. 27 RESISTENCE OR SUPPORT TOUCH IN 280 DAYS.
Attached Image (click to enlarge)
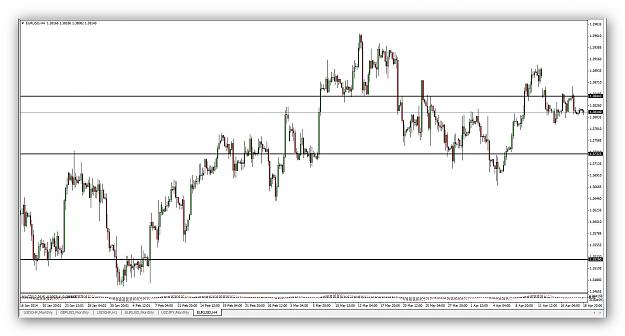
AND 4H OUTLOOK
Attached Image (click to enlarge)
edit we escaped 1 rectangle range. that is midpoint is 1.3955