Dear Members,
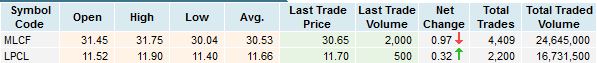
I would like to bring forward an idea which I have been applying in the stock market for long, which is the average that a stock has traded during the day. The average is the rate around which most of the volume has been generated. Is there a possibility that maybe with the help of the tick chart an indicator could be made which could keep generating the average on an hour to 4 hourly basis or maybe minute to minute basis for any given pair? If that becomes a possibility then can we place a horizontal line as a reference for historical data?
If you have any queries kindly ask away without any hesitation.
Thanks and Regards,
Raza
p.s. please find enclosed a picture that might give you an idea what i am looking for.
Attached Image
Raza