{quote} Hi Jimmyboy88, I was short at 0.8980 because that time, it was simple break above overbought on my 1H TF bolinger band. Same Goes when I closed my green short at 0.8926..simply coz it was break down to my oversold. .Of course, if you want to play more longer TF u can use 4H. For these upcoming week, we should see what Monday price will be in AUD.
Ignored
using boll band is your main strategy?
you dont use PA to confirm the reversal? sounds pretty risky to me
of course if you use PA to confirm you wont get the 'best' price
{quote} using boll band is your main strategy? you dont use PA to confirm the reversal? sounds pretty risky to me of course if you use PA to confirm you wont get the 'best' price
Ignored
when you chart stare, you can normally place / visualize indicators.
for example, I use currently ichimoku exclusively, however in the past used band, macd, blah blah.. However when I see an ichimoku potential entry I can visualize the bands, visualize the trend. It is a common thing for new traders (not calling you new, this is just a general statement) to over complicate their charts with numerous indicators. When they get more experienced they start removing the indicators.
A genius is born every minute, me I am lucky if my socks match.
Hi Miss05 thanks for your post... ok, a weekly chart analyst... I've never gone beyond dailies, mainly because I'm an intraday trader, shorter time frames, 4hr, 1hr, 5 min..... but maybe i need to look at the weekly's as well? The way my current trade is going (or not going!) indicates price has found a top and has failed to break up through. This fascinates me.... how much should an intraday trader pay attention to a weekly chart, and how much should a long term trader pay attention to the hourly etc....? I've done pretty well using the shorter...
Ignored
Hi Sonic,
i use to trade daily, those weekly just for longer direction, in fact, i now on short from 0.8936.. and hopefully can go down to arround 0.8890 my target, but...if things not that good in upcoming moments, maybe we will see what will have to do.
I think booth of us should listen more and learn from Whackdiddy, he is more strong on Technical chart and news also.
@Whackdiddy,
yeah i though the 1st movement to be realistic though is AUD should down arround 30 pips, maybe 0.8900.. i totally agree with you bro. But like always...put protection shield armor also. LOL
I've failed many times, but I took the lessons,and never give up.God Bless.
{quote} using boll band is your main strategy? you dont use PA to confirm the reversal? sounds pretty risky to me of course if you use PA to confirm you wont get the 'best' price
Ignored
Hi Jimmyboy88,
i dont use only BBand, i also use others indicator to decide what i have to do.. Totally there will be like arround 3 main indicator that using.
And also, watching different TF is important also, for me, i have to see TF 1H, 4H, 1D and 1W.
Like what Whackdiddy said above, that i used also used many..many indicator at first..but during those 'dark moment' --> still in dark moments also now ^^, i limited my indicator not more than 5 indicator if needed.
Every trader have it own style to trade, i'm sure you can find your style to trade, need to listen more and learn form all these amazing persons in these thread, it's help.
Good luck ^^V
I've failed many times, but I took the lessons,and never give up.God Bless.
thanks to you Miss05, whackdiddy and jimmyboy88... i close off my long for a 10P loss and am now sh from 0.89211. I can see now how the attempt by the bulls has failed, and it would appear that the sellers are now in control.
We don't see things as they are - we see things as we are.
{quote} when you chart stare, you can normally place / visualize indicators. for example, I use currently ichimoku exclusively, however in the past used band, macd, blah blah.. However when I see an ichimoku potential entry I can visualize the bands, visualize the trend. It is a common thing for new traders (not calling you new, this is just a general statement) to over complicate their charts with numerous indicators. When they get more experienced they start removing the indicators.
Ignored
i used to have ichimoku, boll band, macd but right now cut down to 2 indicators only ema. cci and PA to confirm my entry
i am now trying to filter my trades looking for double top and double bottom as many a times the straight rebounce(V) may result in further movement to my disadv. hope i explain properly what i am trying to say heehee
thanks for listening in
thanks to you Miss05, whackdiddy and jimmyboy88... i close off my long for a 10P loss and am now sh from 0.89211. I can see now how the attempt by the bulls has failed, and it would appear that the sellers are now in control.
Ignored
Sonic,
i just seen the chart, it's in the middle of section..dunno where to go now..
Please always do your protection, just in case it will go up..
in 1H time frame, the highest bar is in 0.8940, maybe it will be wise to put protection several pips higher (arround 0.8950 - 60).
Which i believe that if it break above those, it maybe will regain it's way back above.. (in short term.. , for longer term, need to see final price closing later).
@Whackdiidy, how about your opinion for several hours ahead?
I've failed many times, but I took the lessons,and never give up.God Bless.
{quote} Sonic, i just seen the chart, it's in the middle of section..dunno where to go now.. Please always do your protection, just in case it will go up.. in 1H time frame, the highest bar is in 0.8940, maybe it will be wise to put protection several pips higher (arround 0.8950 - 60). Which i believe that if it break above those, it maybe will regain it's way back above.. (in short term.. , for longer term, need to see final price closing later). @Whackdiidy, how about your opinion for several hours ahead?
Ignored
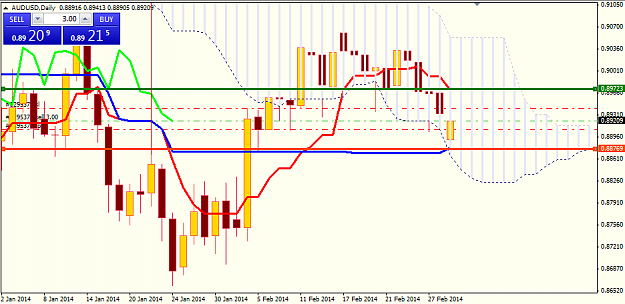
I was about to say the same thing.. the first chart is my daily chart with the green horizontal being top, blue being bottom of daily potential spread. As you can see we are dead center at the moment, so you would have to be crazy to enter i trade.. So I went short @ 0.89217
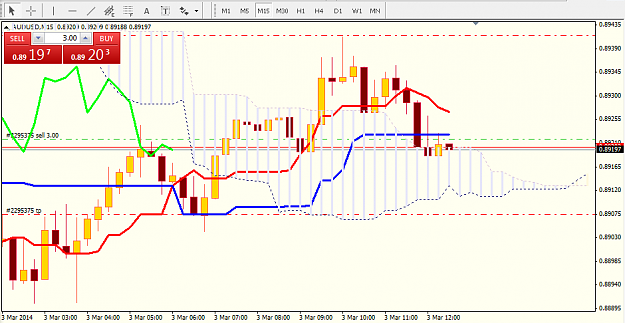
Why, the second chart is my 15m chart, we have bounced off the kijun once and look to be heading down.
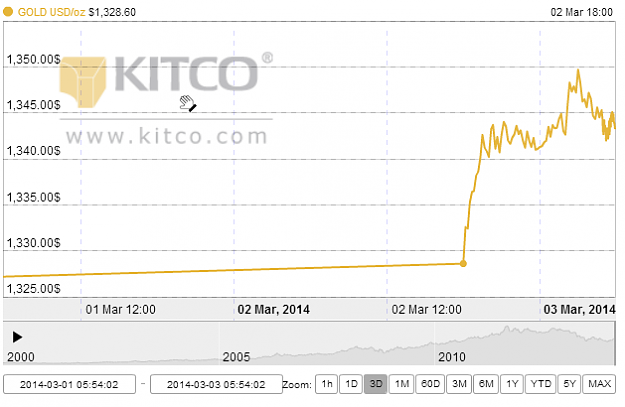
However Gold does worry me, price has gone up so i will be looking for a very small gain and getting out.
Attached Image(s) (click to enlarge)
A genius is born every minute, me I am lucky if my socks match.
{quote} I was about to say the same thing.. the first chart is my daily chart with the green horizontal being top, blue being bottom of daily potential spread. As you can see we are dead center at the moment, so you would have to be crazy to enter i trade.. So I went short @ 0.89217 Why, the second chart is my 15m chart, we have bounced off the kijun once and look to be heading down. However Gold does worry me, price has gone up so i will be looking for a very small gain and getting out. {image} {image}
Ignored
Your daily chart, clearly same result as mine. We have some thought..
Now the surprising thing is, like i said, i'm not experienced in News or other pair related, so these Gold up movement, i will watch it closely.
Thanks Whackdiddy
I've failed many times, but I took the lessons,and never give up.God Bless.
Thank you Miss 05, You're right about SL for a short above 0.8940... mine is at 0.8945.... i am currently sh from 0.8921 and might move SL down if price drops to +10P @ 0.8911. Then, will the 'big round figure magnet (ie 0.8900)' draw price down to 0.8900??? I sure hope so, but there are no guarantees.
We don't see things as they are - we see things as we are.
Thank you Miss 05, You're right about SL for a short above 0.8940... mine is at 0.8945.... i am currently sh from 0.8921 and might move SL down if price drops to +10P @ 0.8911. Then, will the 'big round figure magnet (ie 0.8900)' draw price down to 0.8900??? I sure hope so, but there are no guarantees.
Ignored
^^V
I've failed many times, but I took the lessons,and never give up.God Bless.
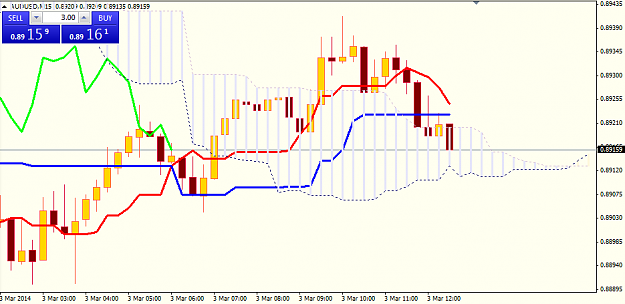
Just so people do not enter a short now.. the movement has already taken place in regards to the charts I put up above.
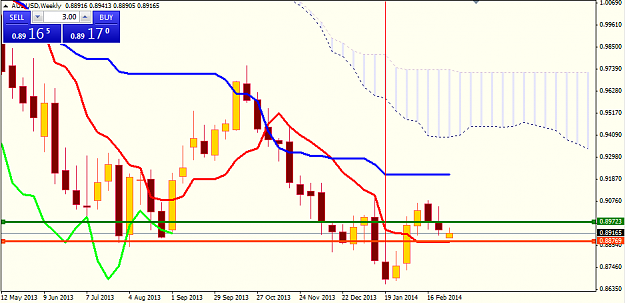
Longer term, if we look at the weekly (second chart) we are a long way from the kijun @ 0.91870 and it is flat meaning it is ... word escapes me... consolidating.. so might be in for a range change back to the bullish trend (price always tries to get back to kijun). US weather is not going to hold up as an excuse in the next couple of weeks / months so AUD should (crystal ball broken) go up. However, AUD is also due a recession, housing bubble burst and companies are pulling out, so that should be a clear indicator to most people to be wary.
Attached Image(s) (click to enlarge)
A genius is born every minute, me I am lucky if my socks match.
Thank you Miss 05, You're right about SL for a short above 0.8940... mine is at 0.8945.... i am currently sh from 0.8921 and might move SL down if price drops to +10P @ 0.8911. Then, will the 'big round figure magnet (ie 0.8900)' draw price down to 0.8900??? I sure hope so, but there are no guarantees.
{quote} {image} Excellent trade. 0.8940 is a proven support turn resistance line. As long as price remain resisted by .8940, the bears are still in control.
Ignored
Hi Ssm, woow.. glad to have you share your thoughts, i hope more will come ^^
I've failed many times, but I took the lessons,and never give up.God Bless.
Thank you Ssm, the 4hr chart currently shows an inverted hammer (as the previous hammer to the current one)....., the weight at the base of the hammer.... price action seems to indicate a bearish stance for now at least.... I'm holding my sh from 0.8921 with a SL at 0.8945... let's see what the international mass human psyche decides on the value of AUDUSD.....
We don't see things as they are - we see things as we are.