{quote} First trade: I was waiting for the break of 168.40. Price went up and I set BuyLimit at 168.40 with SL at 167.99 and price hit my SL. Second trade: I was waiting for the break of 169.80. Price went up and I set BuyLimit at 169.80 with SL at 169.35 and price hit my SL. Was such trades OK or not?
For pure scalping, a smallish SL is ok on this pair, but normally you would run over 100 pips - and that's not enough really. I've heard of some folks in the past who would run a 100~200 on cable and 200 ~500 on GJ, sometimes 1000.
Good day traders. Back to GBP/JPY. Added a pending sell @ 170,400. Stops placed @ 170,750. Wish all a profitable day!
Ignored
I agree with your set up. I reckon that GBP is overbought. However, there is still strong support right now for it. I think next week we'll see at last a slight decline. Or it may start in the US session tonight. The thing to watch for are those events next week regarding Japan, as they have been known to shock the market. It may be prudent to trade GBP/USD or GBP/CHF because of this. The other thing, is that, overall, GBP is still a l/t market favorite (I believe).
GJ is a big mover, so you need to put a long SL if you want to trade in this pair. It can make you a fortune and break you as well, depends whether you want to risk that much.
Its a DRAGON and it always difficult to tame one, you need big heart and a big rope to get on it!
GJ is a big mover, so you need to put a long SL if you want to trade in this pair. It can make you a fortune and break you as well, depends whether you want to risk that much. Its a DRAGON and it always difficult to tame one, you need big heart and a big rope to get on it!
Ignored
TOSH!! It's nonsense like that that keeps people from trading this pair. Nowadays, there's very little to separate forex pairs, once you can trade one, with a few adjustments you can trade them all. You need to widen your stop loss a little with this pair, but the dramatic increase in pips you get when you are on the right side makes it, in my book, by far the best pair to trade, and the spread is now as low as any other pair.
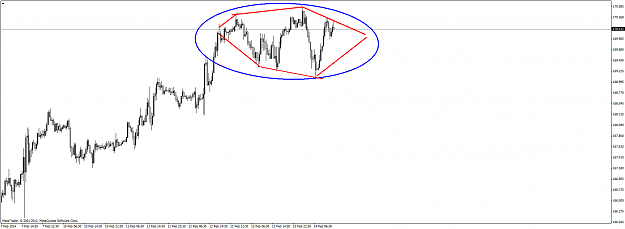
There is no longer any surety that it will break higher. Whereas some folks were expecting a new high, it comes down to where it breaks out from the red lined double triangle.
Attached Image (click to enlarge)
The lines may not be in the exact positions, but are probably close enough.
There is no longer any surety that it will break higher. Whereas most folks were expecting a new high, it comes down to where it breaks out from the red lined double triangle. {image} The lines may not be in the exact positions, but are probably close enough.
Ignored
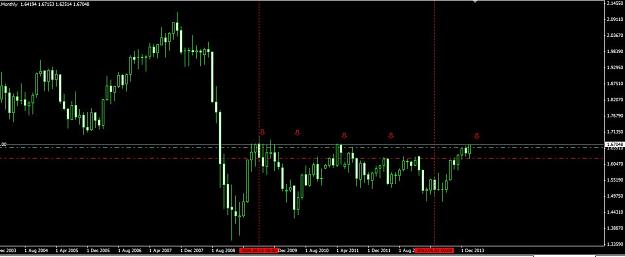
agreed, it's at that awkward level where if you're not in you're either already out or you know you missed the best entry point, ( today) and if you are in you're wondering whether to hold or break. H4 is showing the price sandwiched between the 200 ema and sma, with MACD already tipping over, but the Daily for me is looking pretty bullish up to perhaps 17,228 having turned from looking really bearish last week, and just look at last week's candle on the weekly chart. The monthly saw the rejection just above the 200ema, but it looks as though it may challenge that again next week. basically, it's all to play for. I love this pair - never a dull moment!
{quote} agreed, it's at that awkward level where if you're not in you know you missed the best entry point, ( today) and if you are you're wondering whether to hold or break. H4 is showing the price sandwiched between the 200 ema and sma, with MACD already tipping over, but the Daily for me is looking pretty bullish up to perhaps 17,228 having turned from looking really bearish last week, and just look at last week's candle on the weekly chart. The monthly saw the rejection just above the 200ema, but it looks as though it may challenge that again...
Ignored
It's a topping pattern (or a continuation pattern) and direction is set by which way it breaks out. It doesn't care which TF is oversold or whatever - it simply sets the course. You trade it like a regular triangle - it breaks, retests then off it goes. Sometimes it retests twice.
I think it will turn down, as there's heaps of solid resistance, but the technical support underneath it will run out next week.
Either way, as it stands it will target about 171 to the top or 167 ish to the bottom - in the first instance.
{quote} It's a topping pattern (or a continuation pattern) and direction is set by which way it breaks out. It doesn't care which TF is oversold or whatever - it simply sets the course. You trade it like a regular triangle - it breaks, retests then off it goes. Sometimes it retests twice. I think it will turn down, as there's heaps of solid resistance, but the technical support underneath it will run out next week. At this time, it may only have a target of 168 or 167 ish.
Ignored
all sound. Today I've got it going higher, but whether it breaks last night's high remains to be seen - but I doubt it, 17,056 is my tops. OR it'll just fizzle away and do nothing very much for the rest of the day, that looks quite likely at present.
All trades closed @ 170.6.... i just got tired for 4 days now. Ive got to go for Valentine. I see GJ breaking higher but cant risk it lolz.... i'll join the ride @ new week tade... cheers to my fellow trader in the house.
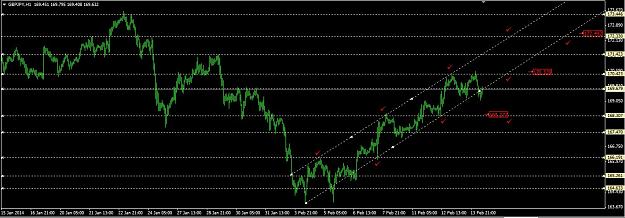
{quote} Believe me there is logic, all over the chart. Are you still short[long]? You might get lucky. You are already down several 100 pips so hold it until 171.10/70.90. We might get a bottom @ 164.60/40. Below it there is no guarantee. Since you are in pain, get a reward from it. {image}
Ignored
Liquidity decreasing. Missed my target by 40 Pips this week. Im going to bail out @ 170.40.
{quote} Liquidity decreasing. Missed my target by 40 Pips this week. Im going to bail out @ 170.40. Long @ 165.15 liquidated @ 170.40 ; +525 Long @ 166.25 liquidated @ 170.40 ; +415 Long @ 167.30 liquidated @ 170.40 ; +310 Long @ 168.85 liquidated @ 170.40 ; +155 Done for the week. Im out. Nice weekend all.
I would like to hear about what you guys think regarding next weeks outlook. I'm just finding out the wonders of this fine pair (Lots of movement )
I'm thinking price will hang out between 169.2xx to 170.2xx and then mid week it appears there should be some news which can knock it out of this apparent range. As I look back it seems this area it has been a point of contention as recently as January and I am assuming it will be that way again. Tuesday / Wednesday of next week looks to have enough news to give a sense of direction to these pairs. At that point there should be a pretty good sized move either way.
In a longer scope I'm expecting it to break through the 170 mark in the near future regardless of where it goes next week.