• Home
  • Forums
  • Trades
  • News
  • Calendar
  • Market
  • Brokers
  • Login
  • Join
  • User/Email: Password:
  • 12:39pm
Menu
  • Forums
  • Trades
  • News
  • Calendar
  • Market
  • Brokers
  • Login
  • Join
  • 12:39pm
Sister Sites
  • Metals Mine
  • Energy EXCH
  • Crypto Craft

Options

Bookmark Thread

First Page First Unread Last Page Last Post

Print Thread

Similar Threads

Broker Challenge "NDD/STP" vs. True "ECN" and "Mkt Mkr" broker talk 46 replies

You talk the talk I walk the talk 8 replies

Lets talk USDCAD 295 replies

geppy is "ugly" when ? 14 replies

Lets Talk Support and Resistance 13 replies

  • Interactive Trading
  • /
  • Reply to Thread
  • Subscribe
  • 58
Attachments: Lets Talk GBP/JPY "the geppy"
Exit Attachments
Tags: Lets Talk GBP/JPY "the geppy"
Cancel

Lets Talk GBP/JPY "the geppy"

  • Last Post
  •  
  • Page 1 23456 8
  • Page 1 234 8
  •  
  • Post #1
  • Quote
  • First Post: Sep 6, 2007 9:09pm Sep 6, 2007 9:09pm
  •  bmwboyee
  • | Joined Aug 2006 | Status: Member | 1,042 Posts
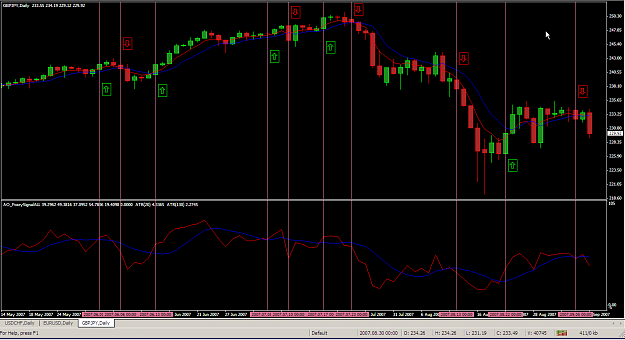
This is a pair that I trade very often. I would love to hear how others trade this and the fibs and supports we can all share.
  • Post #2
  • Quote
  • Sep 6, 2007 9:26pm Sep 6, 2007 9:26pm
  •  mbqb11
  • | Commercial Member | Joined Aug 2006 | 12,004 Posts
I won't consider a trade until a breakout of what were in now
Attached Image (click to enlarge)
Click to Enlarge

Name: eeee.gif
Size: 18 KB
 
 
  • Post #3
  • Quote
  • Sep 6, 2007 10:03pm Sep 6, 2007 10:03pm
  •  Mr Trend
  • Joined Apr 2006 | Status: Mmmm pips. | 1,418 Posts
I trade GBPJPY almost exclusively, doing so with stop and reverse systems. I actually have two main systems. One is S&R, the other is not.

GBPJPY is a beast. I have to trade it mechanically or else I'd fail... I would get in and out too quickly and pulloff stupid mistakes. That's just part of me knowing who I am and adjusting my trading accordingly.
Mr. Trend
 
 
  • Post #4
  • Quote
  • Sep 7, 2007 6:29am Sep 7, 2007 6:29am
  •  SeekingLight
  • Joined Jul 2006 | Status: Charts + PA > * | 3,251 Posts
Not that this is prolly of any help just yet, but I thought I had to do a first chart post somewhere

A solid scenario for this chart if one is to ignore everything else would be: PB, triggered. Fell to tunnel top, bounced. Now prone to feel gravity again. Could fall back inside, even through it, to retest the big red descending TL it broke out of before, this time lower, at around 191.
Then a bullish setup off of that.

An alternative might be a rise, but er, I don't see anything to lean against to kick off from on monthly?

Just a lot of "leg".

This is all just long term thoughts so the chart might not be of much use to some...thought here'd be a nice place to think crazy thoughts publicly though
Attached Image (click to enlarge)
Click to Enlarge

Name: gbpjpy_070907_big.gif
Size: 26 KB
Trust price. Know yourself.
 
 
  • Post #5
  • Quote
  • Sep 7, 2007 6:38am Sep 7, 2007 6:38am
  •  SeekingLight
  • Joined Jul 2006 | Status: Charts + PA > * | 3,251 Posts
Had to do a closeup, too.

Not sure about the wedgy bedgy, but it works aight and it's fun. Heck maybe it was a pennant. Or something other. Maybe the FE is off. Maybe it's all coincidence. It still drew in well

Also the FE stuff I find fascinating.

Still can't find much stuff to make this one go up on the chart

Mayyyyyyyyyyyyyyyyyyyyyyyyyyyyybe a weekly IB break or something...but meh.

Could be I'm just looking at it wrong.
Attached Image (click to enlarge)
Click to Enlarge

Name: gbpjpy_070907_big_ii.gif
Size: 27 KB
Trust price. Know yourself.
 
 
  • Post #6
  • Quote
  • Sep 7, 2007 8:13am Sep 7, 2007 8:13am
  •  Mr Trend
  • Joined Apr 2006 | Status: Mmmm pips. | 1,418 Posts
Quoting SeekingLight
Disliked
Had to do a closeup, too.

Not sure about the wedgy bedgy, but it works aight and it's fun. Heck maybe it was a pennant. Or something other. Maybe the FE is off. Maybe it's all coincidence. It still drew in well

Also the FE stuff I find fascinating.

Still can't find much stuff to make this one go up on the chart

Mayyyyyyyyyyyyyyyyyyyyyyyyyyyyybe a weekly IB break or something...but meh.

Could be I'm just looking at it wrong.
Ignored
Or maybe you got too much friggin' crap on your chart. I wanna punch that chart in the face...

Mr. Trend
 
 
  • Post #7
  • Quote
  • Sep 7, 2007 9:05am Sep 7, 2007 9:05am
  •  philmcgrew
  • Joined May 2005 | Status: I am not your bro | 1,302 Posts
Quoting SeekingLight
Disliked
A solid scenario for this chart if one is to ignore everything else would be: PB, triggered. Fell to tunnel top, bounced. Now prone to feel gravity again. Could fall back inside, even through it, to retest the big red descending TL it broke out of before, this time lower, at around 191.
Then a bullish setup off of that.

An alternative might be a rise, but er, I don't see anything to lean against to kick off from on monthly?

Just a lot of "leg".
Ignored
So you're saying it could go down but then again, it might go up. Did I get that right?
 
 
  • Post #8
  • Quote
  • Sep 7, 2007 9:33am Sep 7, 2007 9:33am
  •  SeekingLight
  • Joined Jul 2006 | Status: Charts + PA > * | 3,251 Posts
Quoting philmcgrew
Disliked
So you're saying it could go down but then again, it might go up. Did I get that right?
Ignored
Nah, I said it looks like there's not much left except gravity and that I lack reasons to keep it up there(there's nothing for it to "stand on").

It must have heard, it fell 200 pips from the time of the posting of the chart
Trust price. Know yourself.
 
 
  • Post #9
  • Quote
  • Sep 7, 2007 9:35am Sep 7, 2007 9:35am
  •  SeekingLight
  • Joined Jul 2006 | Status: Charts + PA > * | 3,251 Posts
Just to emphasize this again:

Quoting SeekingLight
Disliked

A solid scenario for this chart if one is to ignore everything else would be: PB, triggered. Fell to tunnel top, bounced. Now prone to feel gravity again. Could fall back inside, even through it, to retest the big red descending TL it broke out of before, this time lower, at around 191.
Then a bullish setup off of that.

An alternative might be a rise, but er, I don't see anything to lean against to kick off from on monthly?

This is all just long term thoughts
Ignored

If one thinks only singleminded then one will be surprised. I always try to keep my mind to alternative scenarios, so it might have sounded like "it might do either, dunno".
Trust price. Know yourself.
 
 
  • Post #10
  • Quote
  • Sep 7, 2007 12:35pm Sep 7, 2007 12:35pm
  •  BeachBum
  • Joined Oct 2005 | Status: Trade the MAX System with me... | 1,995 Posts
This is one of my favorites to trade.................carefully, very carefully!

The three months represented in the attached Daily chart show 10 trades I took, 9 paid out for me.

The vertical lines are the days that generated the signal; I opened on the beginning of the following day.

Top window: Red = 5 EMA Close.........Blue = 8 EMA Open

Lower window: Red = 8 RSI ...............Blue = 8 SMA

The rest is self-explanatory I believe.
Attached Image (click to enlarge)
Click to Enlarge

Name: gbp_jpy.png
Size: 35 KB
 
 
  • Post #11
  • Quote
  • Sep 7, 2007 4:11pm Sep 7, 2007 4:11pm
  •  BeachBum
  • Joined Oct 2005 | Status: Trade the MAX System with me... | 1,995 Posts
In the last post I forgot to comment on something that shows up nicely just before the trade signal on Aug 22..............the 'pin bar'; this one follows six days of falling prices. I did not take the 'break' of the top of this pin because the RSI was not close to the MA in the lower window. I have seen this situation before and learned that if I wait for the RSI and MA to 'close the gap', I usually get a better trade. In this situation the price ranged for two days before making an upward move as signalled for me on the 22nd. Actually, I could have taken this trade a day earlier using the 4 hour chart (I'll post more about this later), but the volatility of this pair makes me more cautious in these situations.
Attached Image (click to enlarge)
Click to Enlarge

Name: gbp_jpy2.png
Size: 17 KB
 
 
  • Post #12
  • Quote
  • Sep 8, 2007 8:37pm Sep 8, 2007 8:37pm
  •  NewstraderFX
  • | Commercial Member | Joined Sep 2006 | 1,007 Posts
The first thing you do to do when trading the GBP/JPY is to refer to it by its correct name: The Dragon

Calling it The Dragon should tell you something: The ride can be thrilling but it's also dangerous.
 
 
  • Post #13
  • Quote
  • Sep 8, 2007 8:58pm Sep 8, 2007 8:58pm
  •  NewstraderFX
  • | Commercial Member | Joined Sep 2006 | 1,007 Posts
If you except the fact that the two main drivers of currency price are interest rate differentials and equity driven carry trades (or what professionals refer to as equity driven cross-border currency flows), you need to prepare for a wild ride on The Dragon going forward.

Here's the first thing to know before approaching this beast:
The price of GBP/JPY is equal to the price of GBP/USD multiplied by the price of USD/JPY or GBP/JPY = GBP/USD x USD/JPY. This works the same for E/J, A/J and N/J as well.

Let's review what happened in the spring when the dollar weakened dramatically vs the high yielders (GBP, EUR, AUD and NZD) and weakened vs the Yen as GBP/JPY flew towards 251. During most of that time, the fed was percieved to be holding or possibly lowering the overnight rate while the BoE, ECB, RBA and RBNZ were in tightening modes. Interest rate differentals clearly were against the dollar and the dollar weakened dramatically.

At the same time, equity markets were performing very well and carry trades wound. When carry trades wind (GBP/JPY appreciating), the dollar weakens vs the high yielders and gains vs the Yen. What this means is that in the spring, the two main drivers of currency price, carry trade and interest rate differentials, were working SIMULTANEOUSLY to weaken the dollar vs the high yielders.

Let's look at today's situation. Many in the markets are concerned that the US could be going into a recession. That means equities will not be favored and carry trades will unwind (GBP/JPY depreciating), causing the dollar to gain vs the high yielders and lose vs the Yen. But what is also happening is that because the fed looks to be lowering the overnight rate, the interest rate differentials are still favoring the high yielders, meaning that those forces will be pushing the dollar lower. The two main drivers of currency price are now working AGAINST each other. As far as G/U, E/U, A/U and N/U are concerned, it's likely that a "tug or war" will exist and that price will bounce back and forth. This has extremely important implications for GBP/JPY exactly because its price is a product of GBP/USD and USD/JPY.
 
 
  • Post #14
  • Quote
  • Sep 9, 2007 12:58pm Sep 9, 2007 12:58pm
  •  karmostaji
  • Joined Nov 2006 | Status: Dubai | 11,492 Posts
Weekly chart:

As I had predicted that last week would be a bear week and it indeed turned out to be so, now looking at the weekly fibonacci levels, GJ is looking to retest the 50%, 61.8% and even touching 76.4% which is 212.45 area, the weekly chart is still bullish unless we get a weekly bar closing below the lower TL, then things will change but in my prediction we will touch the 76.4% in the coming weeks

http://img509.imageshack.us/img509/1134/gjmw1.gif


Daily chart:

As we have seen in the past weeks, GJ retraced 50% of the move down and it has started to resume it's bearish trend now. The last day of the week, the candle closed well below the 38.2% fibonacci level, the next level is the 23.6% which is also close to the weekly 50%

http://img295.imageshack.us/img295/526/gjst9.gif


4H chart:

Looking at the Green fibs, we completed 61.8% retracement and price has started to resume it's bearish trend. I also added the orange fibs, all these fibonacci are good levels to keep an eye on, the beast will take a rest at some of these levels like it did at the 76.4% (orange)

http://img172.imageshack.us/img172/9167/gjwk0.gif


so, in simple words.. I see 212 in the coming weeks/month
Trade what you see, not what you think.
 
 
  • Post #15
  • Quote
  • Sep 9, 2007 2:39pm Sep 9, 2007 2:39pm
  •  fxvision
  • | Joined Apr 2005 | Status: Lifetime Forex Student | 406 Posts
I am definately bearish going into next week but I think patience is needed for a good entry. Price action shows us an I4B last week so we should stay ready for the next move and after that 50% retracement karmostaji so nicely pointed out, the most likely direction is down. Daily bar from Friday ended as a BEOB finally breaking the tripple low support in the 231.90 area. This alone is a very bearish signal. But we are at a short term rising 4h trend line and close to the daily 365 ema so in these situations I like to wait for the bounce to play out and we could see a retest of the broken support, turning into resistance, in the 231.00-231.70 area. A bearish reversal setup here on the hourly, preferably a nice pin bar or a nice BEOB around the hourly 50 ema, would give us enough momentum to break the trendline, break the daily BEOB and maybe force our way below 229. Good hunting next week!
Always wait for the opportune moment… just be careful not to miss it.
 
 
  • Post #16
  • Quote
  • Sep 9, 2007 3:25pm Sep 9, 2007 3:25pm
  •  BeachBum
  • Joined Oct 2005 | Status: Trade the MAX System with me... | 1,995 Posts
In my last post I explained how my chart setup generated a 'buy' signal at the close of the Aug 22 Daily candle. However, 24 hours prior to this, conditions were favorable for this buy making it worth a look at the 4 hour chart. Dropping down to this timeframe also showed conditions developing for a buy. 12 hours into Aug 22, the 4 hour chart showed a buy. I did not take this early signal because of being very cautious when trading this pair, but this strategy works well on all other pairs too. When the 4 hour lines up with the Daily like this, the trade will most often be a very good one.
Attached Image (click to enlarge)
Click to Enlarge

Name: gbp_jpy3.png
Size: 18 KB
 
 
  • Post #17
  • Quote
  • Sep 10, 2007 12:19am Sep 10, 2007 12:19am
  •  NewstraderFX
  • | Commercial Member | Joined Sep 2006 | 1,007 Posts
I agree the overall trend is down for GBP/JPY-but it's going to be one choppy, back & forth ride. I think that the post NFP price action is a pattern that will be holding in the days and weeks going forward.

There is going to be pressure on the dollar due to the interest rate differentials, yet the reverse cross border currency flows that will occur as equities drop on the recession fears will work in opposition to that.
 
 
  • Post #18
  • Quote
  • Sep 10, 2007 1:21am Sep 10, 2007 1:21am
  •  Mr Trend
  • Joined Apr 2006 | Status: Mmmm pips. | 1,418 Posts
I don't honestly see how anyone can say that the trend is down on GBPJPY. Of course, trend is relative to the timeframe that you're reviewing. If we're talking weekly and monthly, then we have a long way to go to be able to say, with confidence, that we're looking at a downtrend.
Mr. Trend
 
 
  • Post #19
  • Quote
  • Sep 10, 2007 4:23am Sep 10, 2007 4:23am
  •  SeekingLight
  • Joined Jul 2006 | Status: Charts + PA > * | 3,251 Posts
Quoting NewstraderFX
Disliked
The two main drivers of currency price are now working AGAINST each other. As far as G/U, E/U, A/U and N/U are concerned, it's likely that a "tug or war" will exist and that price will bounce back and forth. This has extremely important implications for GBP/JPY exactly because its price is a product of GBP/USD and USD/JPY.
Ignored

This is currently my biggest dilemma. It used to work with strong USD caused by flight to quality when carries unwind, now I got rising majors and a dying USDJPY AND some crosses going bye bye, too.

And I just can't see a several thousand pip GJ death while cable soars to record highs, but things point to bullishness in GBPUSD and EURUSD...while important s/r and TLs are dying on the carry. So I am hard pressed to consolidate these opposing views into one...

One of the two will have to either turn around or "get stuck" so the other can move freely.
Trust price. Know yourself.
 
 
  • Post #20
  • Quote
  • Sep 10, 2007 5:16am Sep 10, 2007 5:16am
  •  habeeb
  • Joined Aug 2005 | Status: Novice | 1,017 Posts
Quoting SeekingLight
Disliked
This is currently my biggest dilemma. It used to work with strong USD caused by flight to quality when carries unwind, now I got rising majors and a dying USDJPY AND some crosses going bye bye, too.

And I just can't see a several thousand pip GJ death while cable soars to record highs, but things point to bullishness in GBPUSD and EURUSD...while important s/r and TLs are dying on the carry. So I am hard pressed to consolidate these opposing views into one...

One of the two will have to either turn around or "get stuck" so the other can move freely.
Ignored
GJ will eventually follow. Dunno much about the fundies driving these markets, but on my chart I've got an ascending triangle on GJ daily with 235.50 being the top. It also created a "W" formation, which could lead us into new highs, or into a head-n-shoulders at 241-45. For now, I'm long till 235.
Keeping it Simple
 
 
  • Interactive Trading
  • /
  • Lets Talk GBP/JPY "the geppy"
  • Reply to Thread
    • Page 1 23456 8
    • Page 1 234 8
0 traders viewing now
  • More
Top of Page
  • Facebook
  • Twitter
About FF
  • Mission
  • Products
  • User Guide
  • Media Kit
  • Blog
  • Contact
FF Products
  • Forums
  • Trades
  • Calendar
  • News
  • Market
  • Brokers
  • Trade Explorer
FF Website
  • Homepage
  • Search
  • Members
  • Report a Bug
Follow FF
  • Facebook
  • Twitter

FF Sister Sites:

  • Metals Mine
  • Energy EXCH
  • Crypto Craft

Forex Factory® is a brand of Fair Economy, Inc.

Terms of Service / ©2023