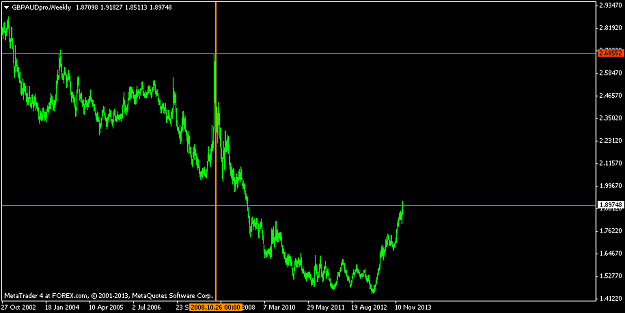
I was playing around with monthly charts and wanted to see where price sat within its all-time historical range; i did this for 28 FX pairs and below is the result...
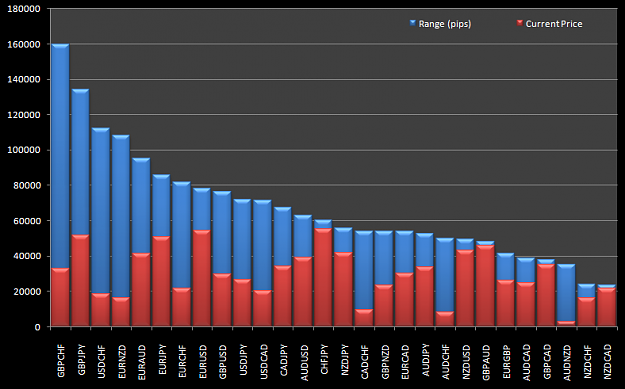
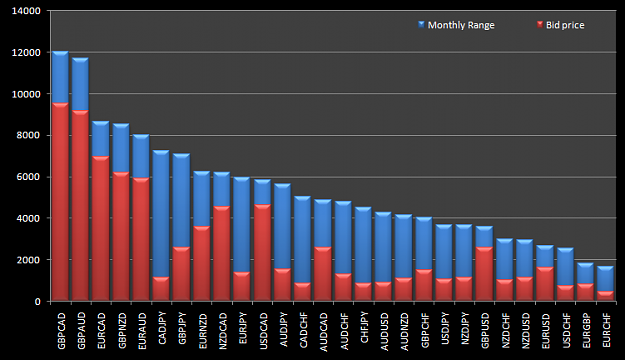
The blue bars show the number of pips between the highest high and lowest low using the monthly chart for each FX pair and is sorted from highest range to lowest. We can see that GBPCHF has been the most volatile pair and NZDCAD the least volatile. The red bars show where current bid price sits from the charts lowest low.
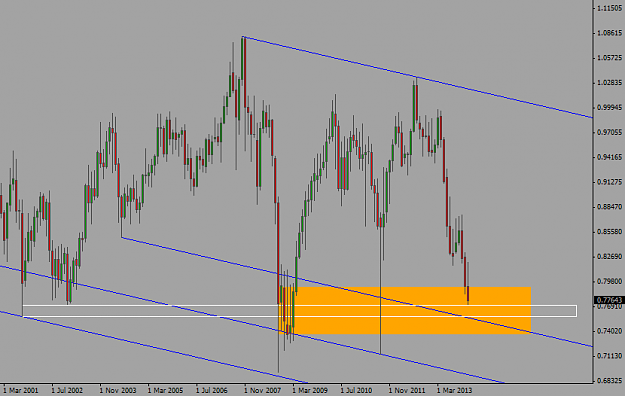
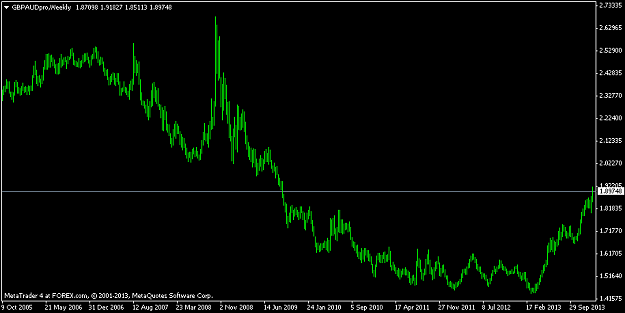
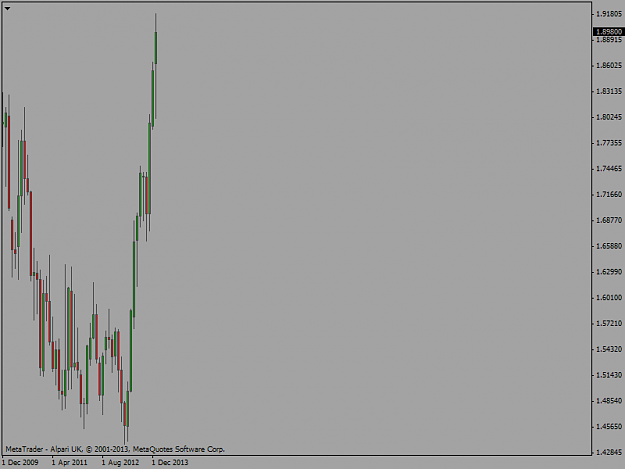
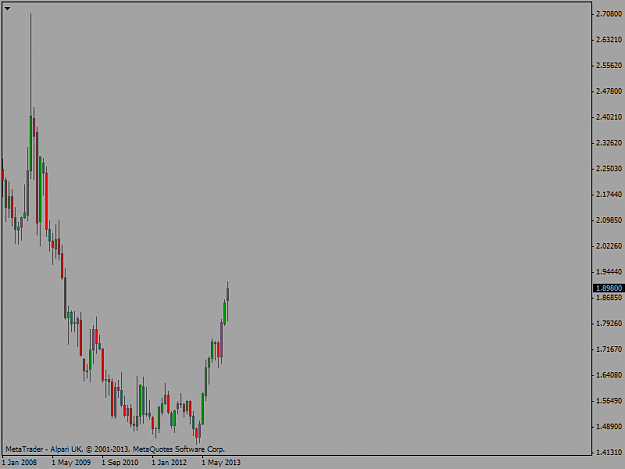
If we now look at the top three pairs that are testing their extremes, we can see that CADCHF, AUDCHF AND AUDNZD are approaching their all-time lows and CHFJPY, GBPAUD and GBPCAD are approaching their all-time highs.
If we know split these above pairs into their base/quote currencies and tabulate the result, we get this...
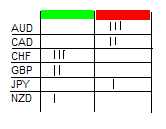
So the underlying theme is AUD weakness and CHF strength, so watch AUDCHF for sells as it approaches it's all time low @ 0.69320, which is 800 pips away (8,000 pipettes).
N.B I've added the indy i wrote for anyone who wishes to do their own research. You'll have to add or edit which pairs your broker uses and uncomment the array, as the print statement has limited length to display all info in one pass. I then copied the Print() result into notepad and formatted the data for excel to produce the above graph using a 2D column graph.
Attached Image (click to enlarge)
The blue bars show the number of pips between the highest high and lowest low using the monthly chart for each FX pair and is sorted from highest range to lowest. We can see that GBPCHF has been the most volatile pair and NZDCAD the least volatile. The red bars show where current bid price sits from the charts lowest low.
If we now look at the top three pairs that are testing their extremes, we can see that CADCHF, AUDCHF AND AUDNZD are approaching their all-time lows and CHFJPY, GBPAUD and GBPCAD are approaching their all-time highs.
If we know split these above pairs into their base/quote currencies and tabulate the result, we get this...
Attached Image
So the underlying theme is AUD weakness and CHF strength, so watch AUDCHF for sells as it approaches it's all time low @ 0.69320, which is 800 pips away (8,000 pipettes).
N.B I've added the indy i wrote for anyone who wishes to do their own research. You'll have to add or edit which pairs your broker uses and uncomment the array, as the print statement has limited length to display all info in one pass. I then copied the Print() result into notepad and formatted the data for excel to produce the above graph using a 2D column graph.
Attached File(s)
Politics is the womb in which war develops.