DislikedHello, Looks like a great thread. I have a few questions. I hope I am on-topic; my apologies if I am not. I see a lot of chart patterns on this thread. Chart patterns have always seemed disingenuous to me, because they always look so obvious in hindsight, but much murkier in real time to see as the 'pattern' is 'emerging'. Recently, I have developed a low-level ability to 'read' the market directly from a bar chart (instead of indicators only, which is what I did before) so I have a new interest in patterns because they are beginning to make sense...Ignored
Regarding questions 1 and 2:
Mr Pip has outlined his personal thoughts on this in three Word documents.
In 2 of these documents (ABCD and Gartley Rules of Engagement), he goes into detail on the parameters which validate (and invalidate) a pattern.
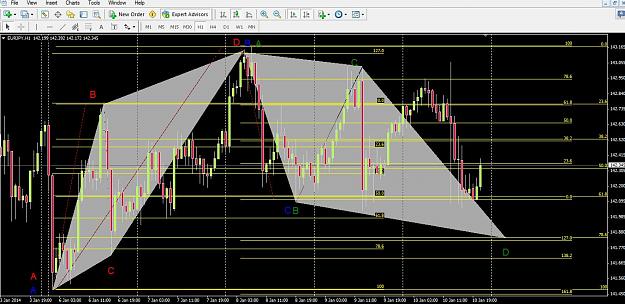
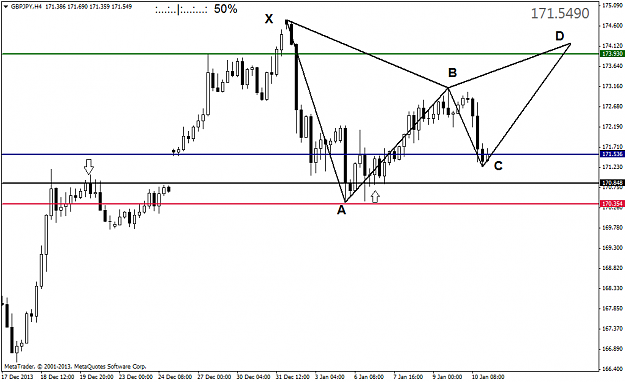
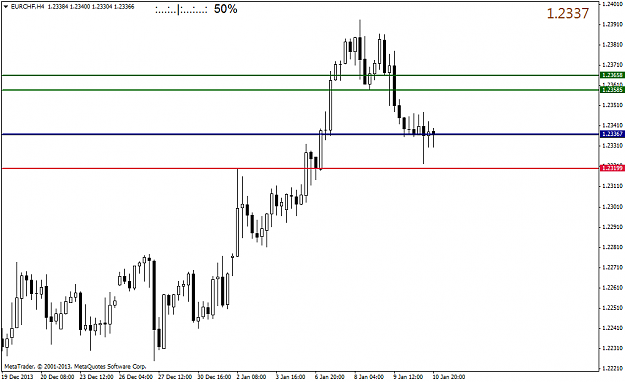
The other patterns (Crab, Butterfly, Bat) are outlined in the third document Advanced Patterns Recognition Guide. The thread is not really focussed on these, but nevertheless you can probably draw your own conclusions from the shaded Price Reversal Zones as to what the acceptable limits are.
You will be able to find these document attachments towards the start of the thread.
Regarding question 3:
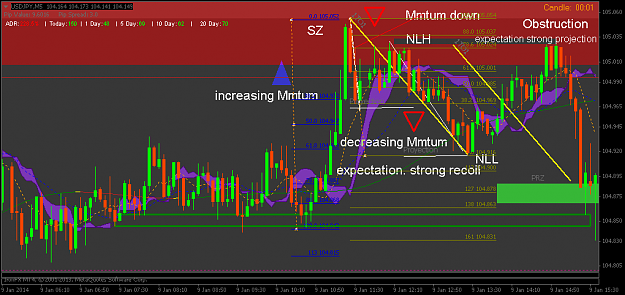
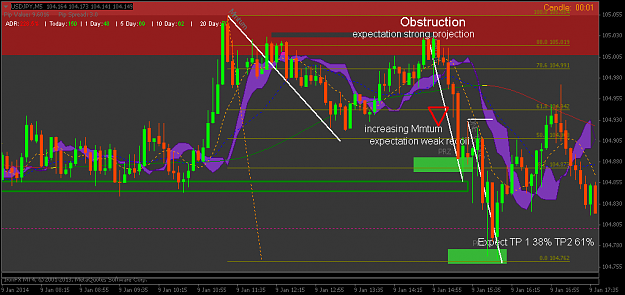
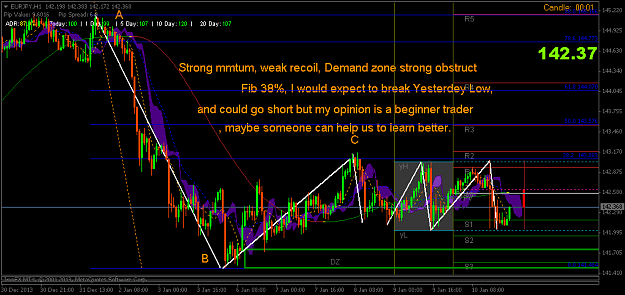
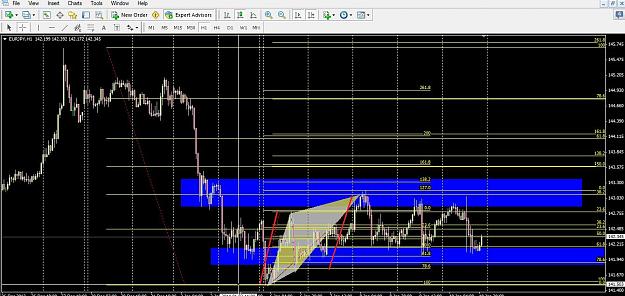
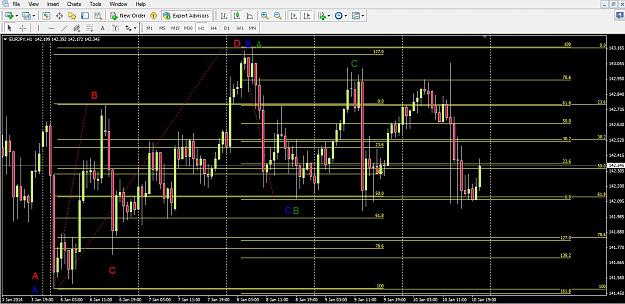
This boils down to an understanding of order flow and price action.
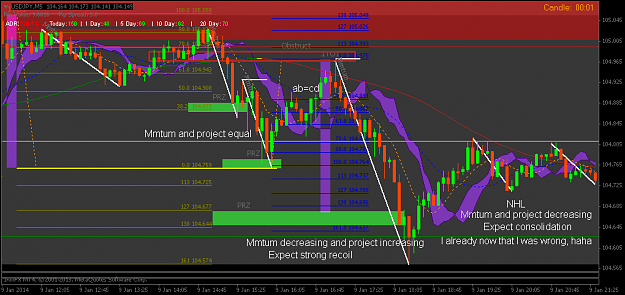
The patterns give us key points at which to watch for weakness (which suggests reversal).
Typically these points are either the completion of an AB=CD pattern, or an early ("aggressive") entry at C.
If price is showing strength within one of these key zones, it is perhaps better to wait for another opportunity.
Personally, I find that detecting weakness in the current direction can be spotted quicker than strength in the other direction. If that makes sense!