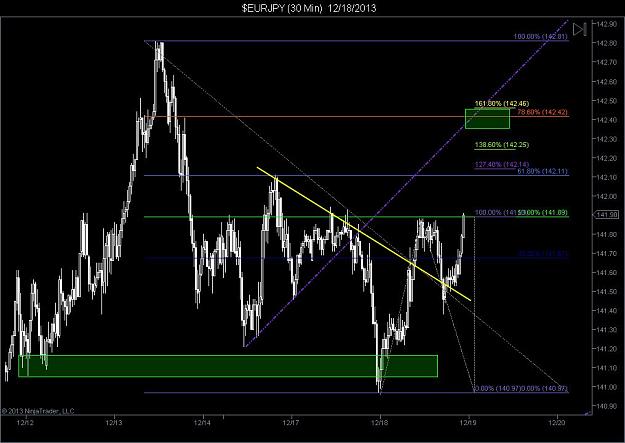
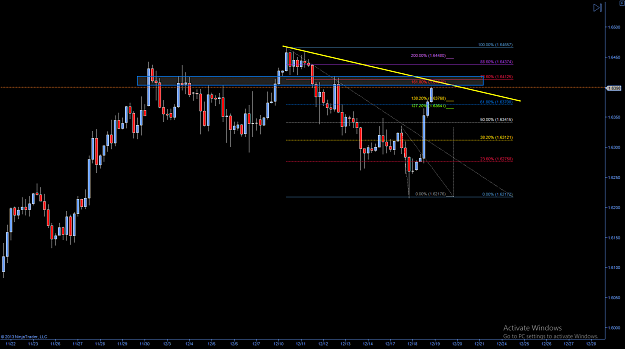
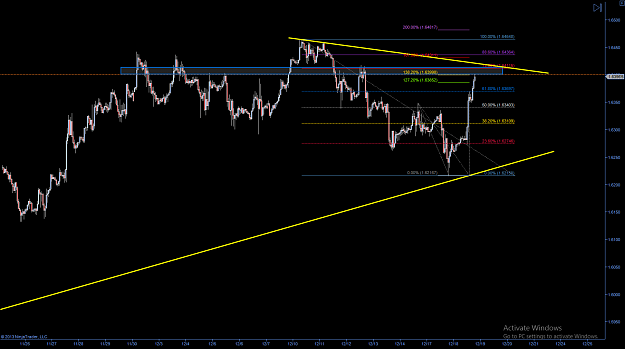
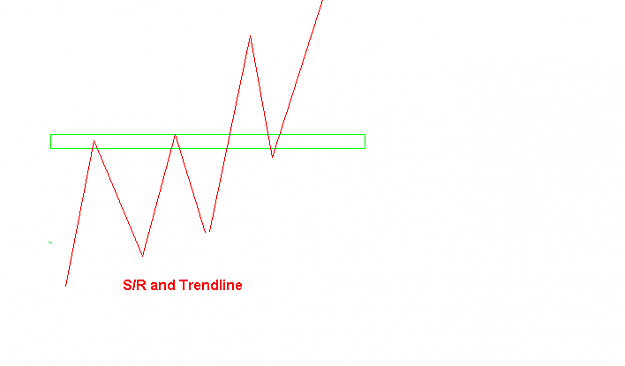
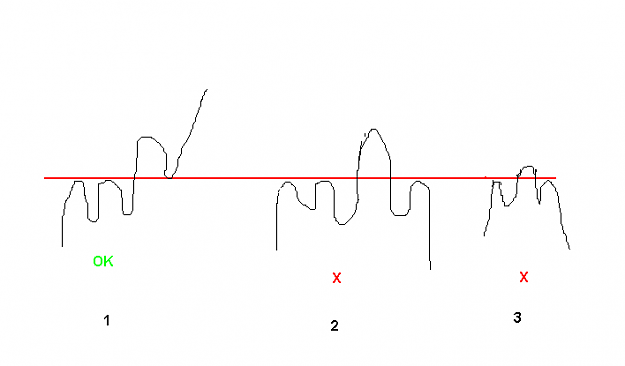
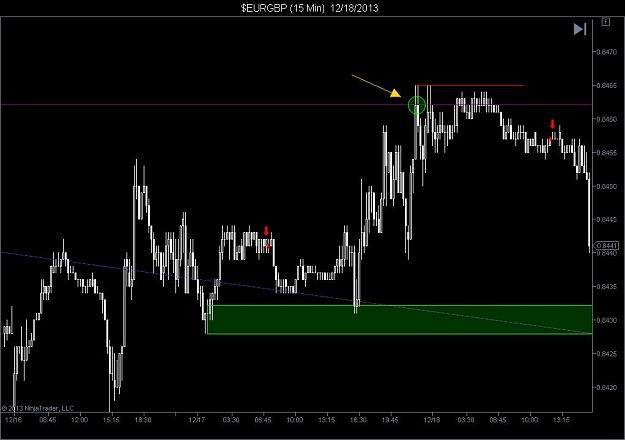
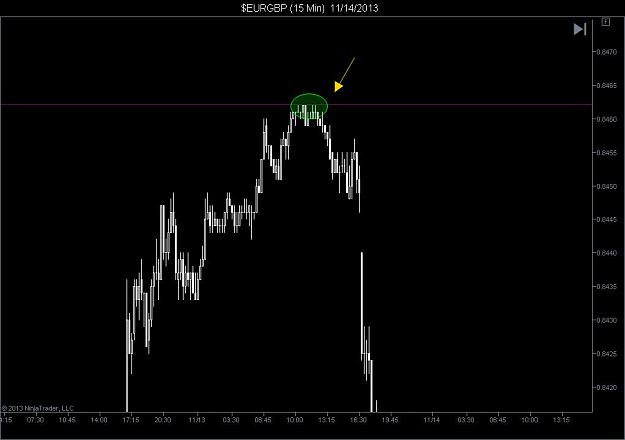
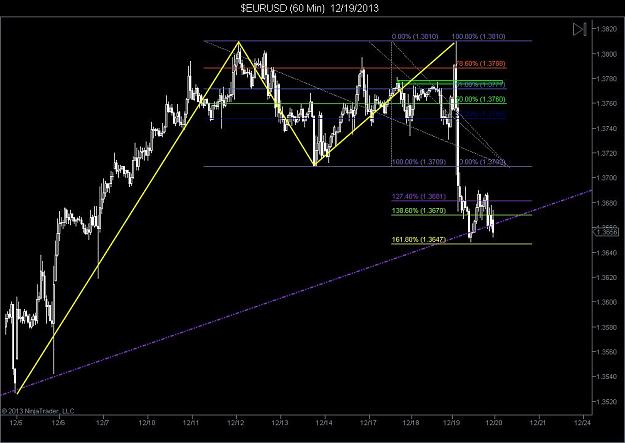
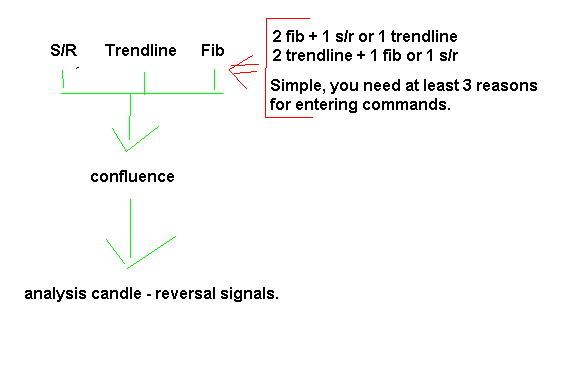
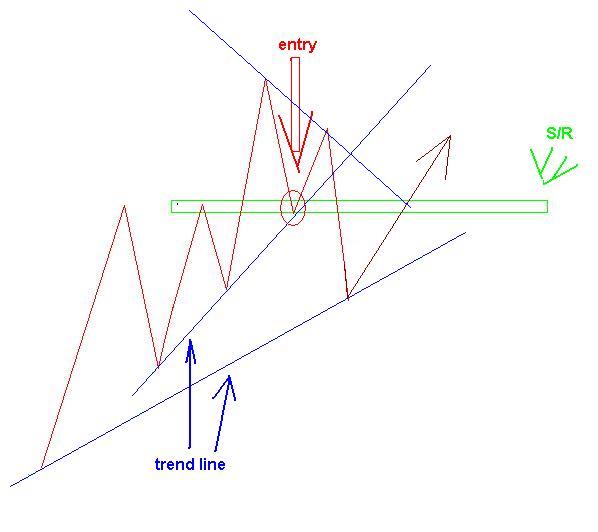
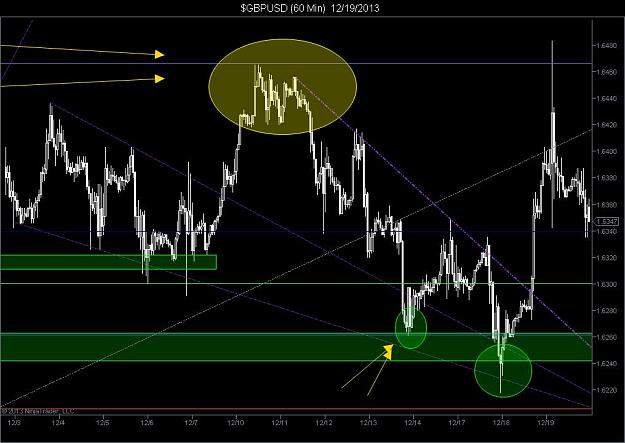
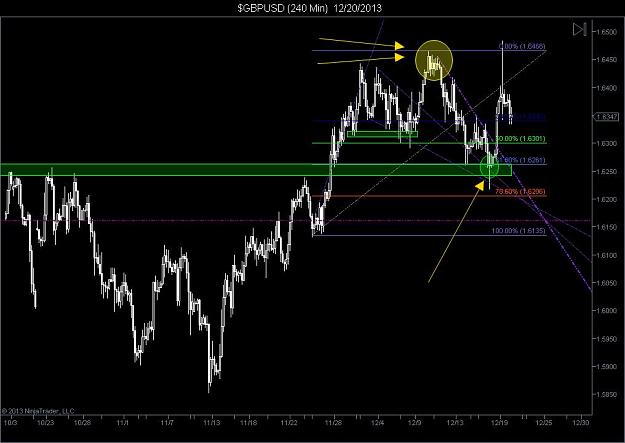
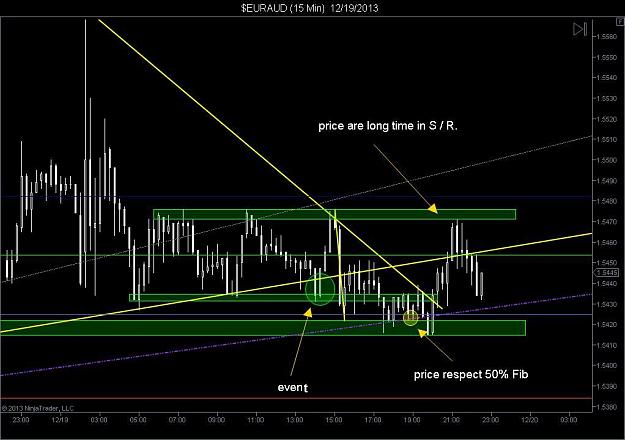
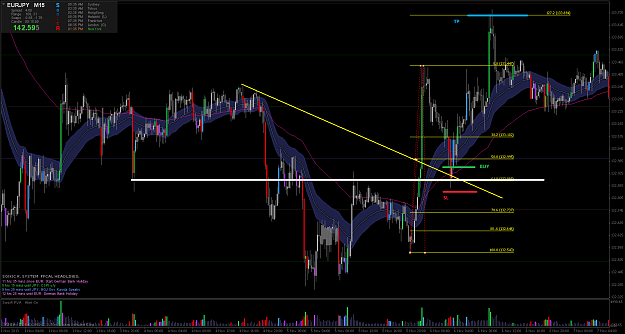
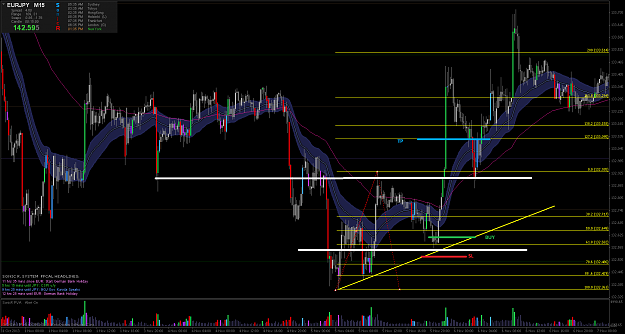
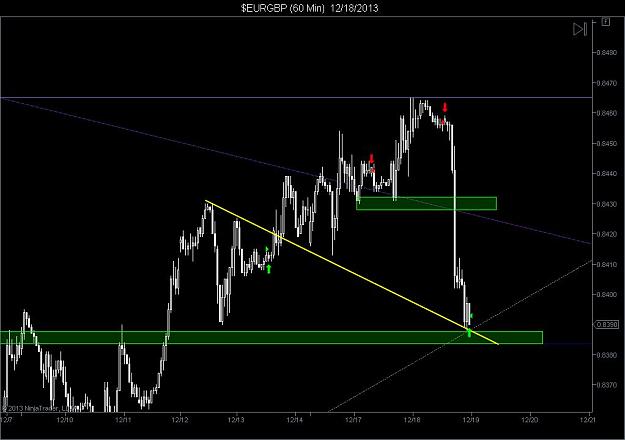
Disliked{quote} If the price moves on the blue square, it is a confluence area and one where the command potential. This is the approach I capture the transaction screen. {image} {image}Ignored
Trading in the zone
Super Simple System 314 replies
Super Carry Trade Trading System 731 replies
What is the Differences between Fibonacci Fan and Fibonacci Arcs 15 replies
Disliked{quote} Nice trade hao, looking at the chart now the trade went into the direction of analysis Entered EUR/JPY H1 long, trade stooped out at BE only to continue up, stop was -20 pips, when reached + 12 stop moved to BE {image} {image}Ignored
DislikedHi there Hao. I'm glad you are making harmonics your own with this strategy. I will be a regular visitor/participant of your thread. I invite you to see my journal as well since we share similar concepts.Ignored
Disliked{quote} Welcome you come to my theme. visual appearance of my system and the same system through Mr.pip. But by using different. - My system moving from A to B confluence, not using the model. - Other systems using S / R and Trendline. They need a large stop loss. Such systems is difficult to distinguish but adjusting large price . - In case of adjusting price to near confluence A. Everyone blames eventually random ,I think it's adjusting price a greater extent. Such systems have to ratio be complete average. TP and still acne commercial. Simply...Ignored
Disliked{quote} Thank you hao, will catch up with the thread and follow your progress, keep it up!Ignored
DislikedMy opinion about: indicator, harmonic, S / R, trendline. harmonic patterm - Scott M. Carney - Success rate: 60 -70% - Disadvantages: PRZ wide, wide stop loss. - I trade more than 1 month. {image} {file} harmonic model improvements - Mr. PIP. - Success rate: 70-80% - PRZ smaller. your trade less. - I trade more than 6 month. PRZ smaller. wait at point D commercial, very uncomfortable. you wait for the BAT model, crabs, butterflies. It can pass through PRZ or close to the PRZ, leg ABCD (BAT = XABCD) can form an AB = CD pattern smaller. Because smaller...Ignored
DislikedNow lets see if this analysis works out, looking at GBP/USD H1 for short What do you think of this {image} {image}Ignored
Disliked{quote} Thanks hao for all thee hard work your doing into this thread, I can see what you mean by showing all the previous chart, it just needs time for information to sink that am able to use them in real trading as In today I made an analysis, and then because of over analysis I failed to follow the original plan, and thus the trade follow my mistakes, its about plotting all what you have said above to see where the expectations of price might headed Thanks again This is the trade taken today Trade taken on the 1H chart , confluence was found...Ignored
Disliked{quote} sorry, I have not tested it. 1 / circles in yellow: I do not have a reason to sell. In this case I will not sell, I encountered many cases of early reversal, moving closer to Trendline or S / R. ( 60min chart ) 2 / price Join the potential confluence area, you should wait to buy reversal. {image} {image}Ignored
Disliked{quote} Hi Hao and TheScorpS Hi Hao, I'm studying your system. I share your view, thanks for your explanations. I hope to learn from you, and improve my trading. excuse my English too. Greetings pampaq In the second graph, posted by TheScorpS, you can add that when D within XA does not exceed B (low momentum), it is possible to project a ONE TO ONE (BC) from B. And when you get 0% of XA, validates ONE TO ONE (100%) of XA from point B. So with a very small SL I have two TPs a 100% of BC from D, and the other TP, the XA projection from B. What you...Ignored
Disliked{quote} Hi Hao, thanks again for putting your touch into this analysis, there was FOMC coming as I remember so stayed out from the market and didn't trade, pa went high as you draw in the chart and reverseIgnored
Disliked{quote} Hi Hao and TheScorpS Hi Hao, I'm studying your system. I share your view, thanks for your explanations. I hope to learn from you, and improve my trading. excuse my English too. Greetings pampaq In the second graph, posted by TheScorpS, you can add that when D within XA does not exceed B (low momentum), it is possible to project a ONE TO ONE (BC) from B. And when you get 0% of XA, validates ONE TO ONE (100%) of XA from point B. So with a very small SL I have two TPs a 100% of BC from D, and the other TP, the XA projection from B. What you...Ignored