• Home
  • Forums
  • Trades
  • News
  • Calendar
  • Market
  • Brokers
  • Login
  • Join
  • User/Email: Password:
  • 8:10am
Menu
  • Forums
  • Trades
  • News
  • Calendar
  • Market
  • Brokers
  • Login
  • Join
  • 8:10am
Sister Sites
  • Metals Mine
  • Energy EXCH
  • Crypto Craft

Options

Bookmark Thread

First Page First Unread Last Page Last Post

Print Thread

Similar Threads

Fundamental Analysis, Technical Analysis Or Graph Analysis? 28 replies

technical analysis -or- fundamental analysis 327 replies

Technical Analysis vs Practical Analysis 3 replies

future technical analysis, or spot analysis 4 replies

S&P 500 Analysis and Discussion Thread 3 replies

  • Interactive Trading
  • /
  • Reply to Thread
  • Subscribe
  • 1,038
Attachments: GU, GJ and EU Analysis Thread
Exit Attachments

GU, GJ and EU Analysis Thread

  • Last Post
  •  
  • 1 6061626364 Page 65
  • 1 626364 Page 65
  •  
  • Post #1,281
  • Quote
  • Dec 8, 2013 5:26pm Dec 8, 2013 5:26pm
  •  45Condor
  • Joined Aug 2009 | Status: Technical fundamentalist | 2,202 Posts
Quoting smikester
Disliked
{quote} I will be looking for price action off .8400 in Eur/Gbp.
Ignored
Indeed, rode it down from .8450 to .8290-ish... I can't remember the exact point at which I got cold feet and cut short from my target of the 61.8 FE.

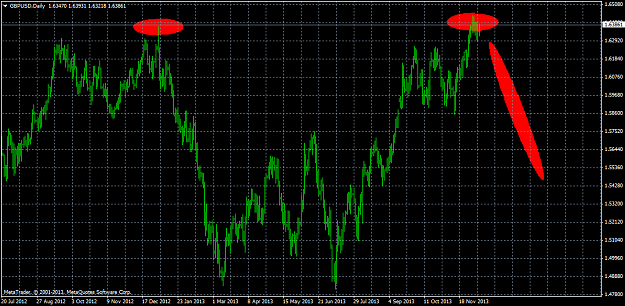
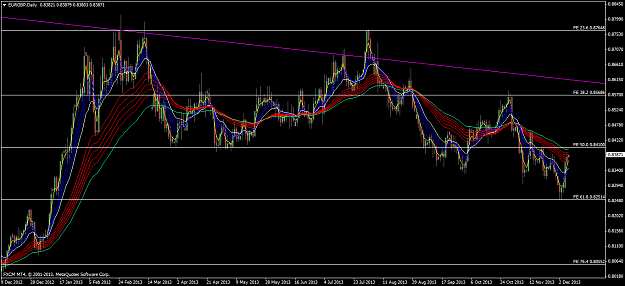
Was looking again at the end of last week for another bite if PA started to mix it again with the descending Guppy profile on the daily. That criteria is met, and so I am watching Cable and the Dollar for indications of an entry point.

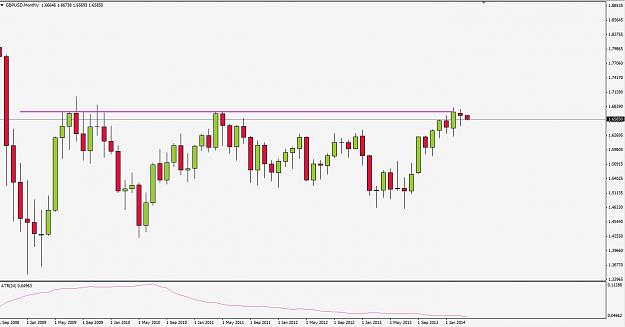
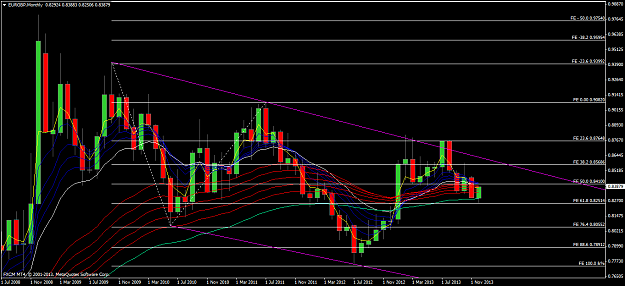
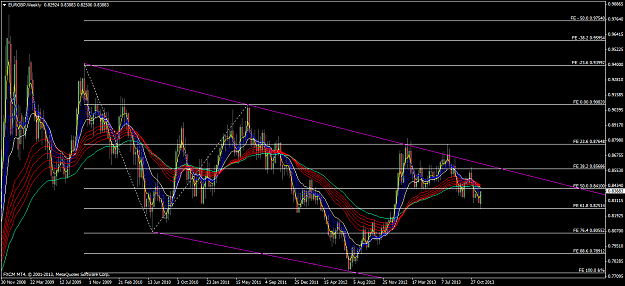
The monthly and weekly seem primed for a rejection south.

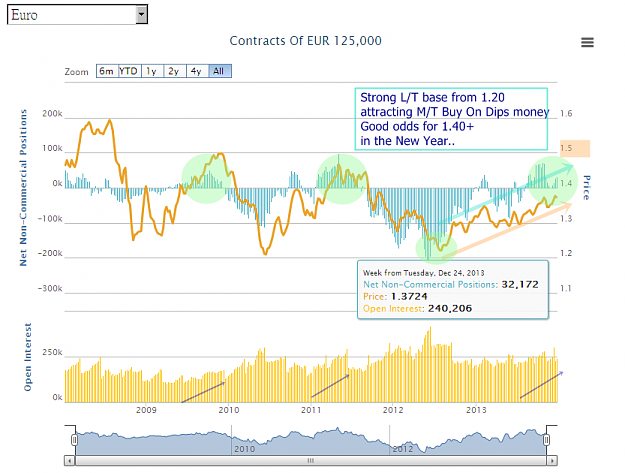
CNDollar... nice post.
Attached Images (click to enlarge)
Click to Enlarge

Name: eurgbpmonthly.png
Size: 70 KB Click to Enlarge

Name: eurgbpweekly.png
Size: 79 KB Click to Enlarge

Name: eurgbpdaily.png
Size: 78 KB
Author of: For Pip's Sake! (Available at Amazon... :-) )
 
 
  • Post #1,282
  • Quote
  • Dec 9, 2013 5:06am Dec 9, 2013 5:06am
  •  chonchy
  • Joined Aug 2007 | Status: The Bitcoiner | 20,032 Posts
........Very nice posts, very nice analysis like always from great traders like your self's.......... have a good week ahead, Smikester 45 and CDN......
The Chonchy
 
 
  • Post #1,283
  • Quote
  • Dec 9, 2013 1:20pm Dec 9, 2013 1:20pm
  •  davidsayli
  • | Membership Revoked | Joined Nov 2012 | 616 Posts
GBP/USD DAILY CHART

We are in the resistance zone. We may see a sudden drop to the 1.5480

BE CAREFULL !!!
Attached Image (click to enlarge)
Click to Enlarge

Name: gbpusddaily.png
Size: 45 KB
 
 
  • Post #1,284
  • Quote
  • Dec 9, 2013 1:21pm Dec 9, 2013 1:21pm
  •  davidsayli
  • | Membership Revoked | Joined Nov 2012 | 616 Posts
EUR/USD WEEKLY CHART

TREND-LINE ANALYSIS

We came edge of the trend-line. We can see a sudden drop to the 1.2750-1.3115 area.

BE CAREFULL !!!
Attached Image (click to enlarge)
Click to Enlarge

Name: eurusdweekly.png
Size: 53 KB
 
 
  • Post #1,285
  • Quote
  • Dec 9, 2013 1:21pm Dec 9, 2013 1:21pm
  •  davidsayli
  • | Membership Revoked | Joined Nov 2012 | 616 Posts
EUR/USD DAILY CHART

DOUBLE TOP "M FORMATION"

We may see a sudden drop to the 1.3115
Attached Image (click to enlarge)
Click to Enlarge

Name: eurusddaily.png
Size: 44 KB
 
 
  • Post #1,286
  • Quote
  • Jan 4, 2014 9:23pm Jan 4, 2014 9:23pm
  •  cdndollar
  • Joined Sep 2012 | Status: classic Arts | 1,043 Posts
Quoting cdndollar
Disliked
{quote} Euro has resumed the M/T up trend since the above update & is now within 1 figure of the year high.. Since July of last year, Euro & Cable had diverged 10+ figures from pure fundamental value in real life trading while the non believers dwell on QE & other fundie tea party talks.. near term, there's good odds for Euro to print new year highs prior to a correction in the new year.... {image}
Ignored
Euro & Cable started the new year with corrections from new highs..
While a few figure PA may look like a falling Tsunami to S/T & intraday types.. for long distance players, the levels of interest are last December highs & November lows with January's tendency to print the high & low for the following 6 months to a year..

Boomerang Update:
July --> August --> September--> October--> November --> January
Attached Image (click to enlarge)
Click to Enlarge

Name: EURUSD-20140103-Boomerang.png
Size: 101 KB

Above the 1.33~1.34 yellow brick zone, up trend continuation from last July with M/T targets 1.40~1.50..
Sustained weeklies below tilts the odds for a return to the 1.27~1.20 L/T support zone..

Path of the elephants:
Attached Image (click to enlarge)
Click to Enlarge

Name: EUR COT-20131224.png
Size: 72 KB

Strong L/T support base from the July 2012 lows attracting Large Spec money buying on every good size dips..
 
 
  • Post #1,287
  • Quote
  • Apr 4, 2014 5:03am Apr 4, 2014 5:03am
  •  smikester
  • Joined Mar 2007 | Status: Member | 8,618 Posts
A view of "Abenomics":

"In that context comes the monetary insanity of Abenomics and the economic freak-show of Japan Inc. After 20 years of relentless borrowing and money printing, it teeters on the edge of an economic abyss, shackled with massive public debt, a shrinking/aging population, a rapidly depleting savings pool, comically low interest rates on its public debt and a truly horrid fiscal posture—namely, it will need to borrow 50% of every dime its spends in the year ahead, even with the long-overdue rise of consumption taxes beginning in April."

Taken out of context from here.
Gone to a better place
 
 
  • Post #1,288
  • Quote
  • Apr 4, 2014 5:33am Apr 4, 2014 5:33am
  •  smikester
  • Joined Mar 2007 | Status: Member | 8,618 Posts
Looking at Cable:

Attached Image (click to enlarge)
Click to Enlarge

Name: gbpusd140404m1.JPG
Size: 91 KB


February closed strongly a bit higher than the last 5 years. The February candle is intriguing because it is an engulfing bullish candle by any definition, with a strong close above resistance. This, followed by an inside bar. We also have a volatility reading - Monthly ATR(24) - lower than it has been for more than 10 years. If the trend had been a bit longer then that inside bar would be an obvious long trade, albeit attenuated to daily or lower entries, it being 300+ pips.

I can say with certainty that something will happen. I hope that something is surprising in the form of a volatility break out - probably an inside bar continuation, possibly a hikakke type reversal.
Gone to a better place
 
 
  • Post #1,289
  • Quote
  • Last Post: Apr 10, 2014 8:29am Apr 10, 2014 8:29am
  •  smikester
  • Joined Mar 2007 | Status: Member | 8,618 Posts
Yesterday was the highest daily close for a long time. 2009 to be exact. Since we have good numbers coming in, perhaps 1.68 won't be a reversal point?
Gone to a better place
 
 
  • Interactive Trading
  • /
  • GU, GJ and EU Analysis Thread
  • Reply to Thread
    • 1 6061626364 Page 65
    • 1 626364 Page 65
1 trader viewing now
Top of Page
Forex Factory Blog Updated: Alerting All Members
  • Facebook
  • Twitter
About FF
  • Mission
  • Products
  • User Guide
  • Media Kit
  • Blog
  • Contact
FF Products
  • Forums
  • Trades
  • Calendar
  • News
  • Market
  • Brokers
  • Trade Explorer
FF Website
  • Homepage
  • Search
  • Members
  • Report a Bug
Follow FF
  • Facebook
  • Twitter

FF Sister Sites:

  • Metals Mine
  • Energy EXCH
  • Crypto Craft

Forex Factory® is a brand of Fair Economy, Inc.

Terms of Service / ©2022