{quote} 1 / I found an AB = CD pattern small. 2/ I do not see strong confluence. you need to assess the confluence with size model. a small structural model is not powerful enough to change the command line of large models.
Hi gaf Heres how I interpret your chart, this is how I understand it so far, hope am correct tho I don't have a way to view the chart you posted since I cant open ninja trader, tried too but couldn't {image}
Ignored
Thanks for the help attempt but my question is a bit more subtle. I know we're heading into a support zone. I just drew the line as guide for people's eyes. My question is more about the stop run and doing this in real time.
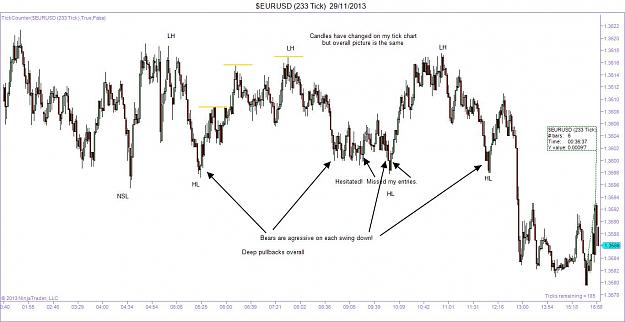
Facts: We have made an overall shallow NSL in the intermediate term PA. We have made an overall HL intermediate term. We are at support for the 4th time on good momentum as it often is in a range. Then we stall out short of support. We make some nsh and hl short term. This indicates short term orderflow may be changing. We had a deep pullback on that HL but in a range we always have deep pullbacks yet we eventually break out.
The second short term leg down has made another nsh but the leg is on good momentum with a giant doji on my previous chart (the tick bars change when I reload). We have PA in the zone again with a deep pullback short term which could indicate strength returning or stop run. In this case it was a stop run but if you look at the next leg it retraces and then blows through support. We may expect that the last leg should have a deep pullback once again however it fails @ R and the range breaks down. Now we had ample warning if we took that trade to get out but I didn't see an entry other than @ structure and my candles didn't look so good at the time against that momentum.
So my question is: I just want to know when it is safe to trade double bottoms and double tops. This causes me grief as I'm often standing on the sidelines conflicted by what I see real time.
Yes after the fact I can say well nsh @ support duh. But often this will happen during a trending market as it transitions into a range and I get caught. I just want to strengthen my knowledge so I can double my bottom line. Thanks again for the support. Cheers.
John
NOTE: That last HL could be considered a small NSL depending on where the candles closed. On my original chart it closed higher.
Hello everyone , iwan to adapt that trading system to my current and combine them together.
where can i learn about Harmonic patterns?
where start to learn? where is advanced material? is there any tip?
I would be glad if you provide me the learning material
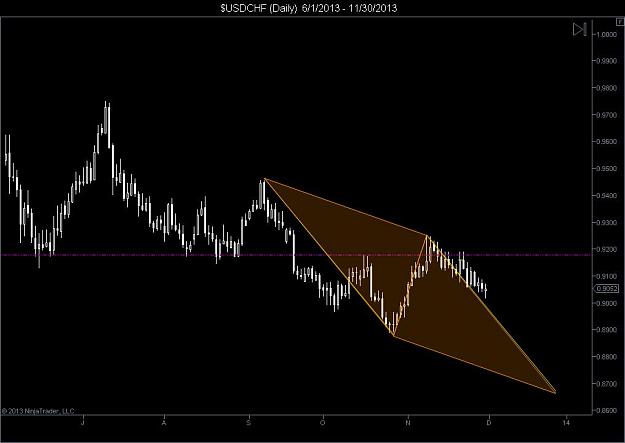
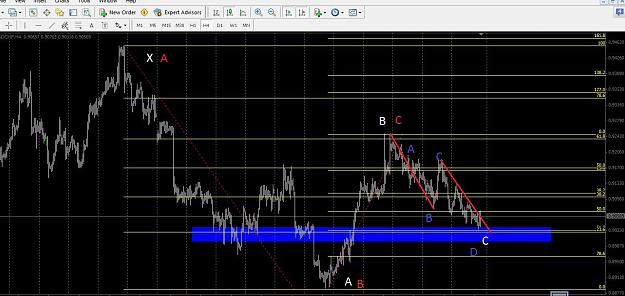
I see on 4hr quite a bit of confluence enough for a short term buying opp, Am I wrong?
ABCD completion,
127 ext of AB leg of ABCD completion
Aggressive C of possible bearish gartley
Aggressive C of ABCD
current CD leg of larger ABCD to be aware of
some structure to the left
Attached Image (click to enlarge)
Never said I was Batman,all I'm saying is you'll never see us together.
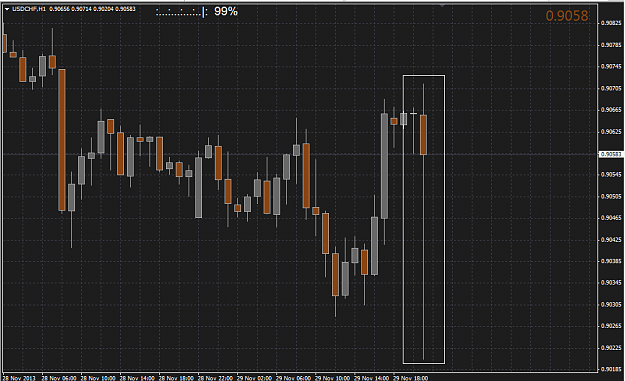
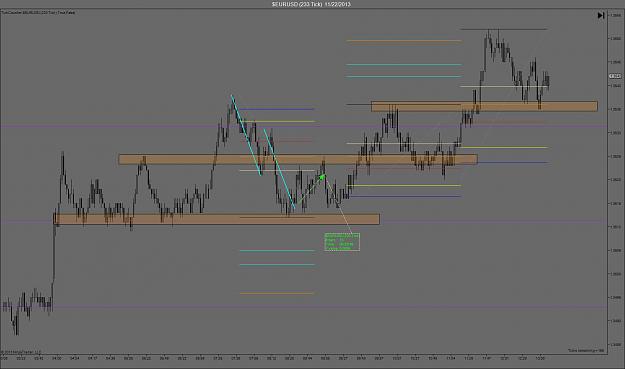
Hello Mr. Pip. I watched your video about PA. I would like to know that how would you face/decide the direction when this kind of consolidation happens. {image}
Ignored
I don't have access to charts at the moment but when I do I will show you. I have been monitoring your posts and recommend the you take the time to go over the material that has already been posted. I seems that you need to do that again. If you look closely the information is there.
Areas of congestion or consolidation require greater attention do detail but the facts are there and from that the answers you seek. We can never know with complete certainty where price will move next but for the most part have total advantage.
Good day Mr. Pip I'm am really interested in learning how to trade Harmonics, i would just like to ask, is the a pre-requisite skill set or knowledge that s needed before learning from this forum? or would i be able to understand everything as I go along ? Thank you for making this thread, I really appreciate the opportunity Happy trading
Ignored
Welcome Levi,
It is not a prerequisite but it does help a bit if you understand certain things as basic knowledge. go to babypips.com and read in the school tab preschool and kindergarden the rest is stuff that will do more harm then good so stop there. Read through the thread and post we will help you.
My stops are getting hit every time. Market also going against my position direction. I don't understand where I am doing mistake I don't know much about following things : Fib Pivots.
Ignored
This is happening for to main reasons.
1. Entry - You must learn to time your entry. This is achieved by having an expectation as to what price should do next. also, by sharpening the bar by bar analysis.
2. Stops - Having proper stop placement is critical. Are you giving the trade enough breathing room. Take the time to analyze the reasons why you are getting stopped out. Let's say that your current entry timing is early but you are good at anticipating the order flow. Figure out on average how many pips does the trade go against you before it turns and heads in your anticipated direction. Once you figure out how many pips that is, your stop can never be smaller then that. I always place mine where I know price should not be if I am right on my analysis.
Study all trades the winners and specially the losers always try to identify your weaknesses so that you can identify them and work on fixing them.
{quote} So my question is: I just want to know when it is safe to trade double bottoms and double tops. This causes me grief as I'm often standing on the sidelines conflicted by what I see real time. Yes after the fact I can say well nsh @ support duh. But often this will happen during a trending market as it transitions into a range and I get caught. I just want to strengthen my knowledge so I can double my bottom line. Thanks again for the support. Cheers. John NOTE: That last HL could be considered a small NSL depending on where the candles closed....
Ignored
its safe to trade double tops or double bottoms when you can recognize something that indicates price reversal, obviously.
in my opinion the most important part is evaluating the strength of the supply or demand zone in which you are watching for a double top/bottom. if price has bounced from a certain level multiple times you can expect it will do so again, but this is not enough. the only time we expect a breakout is if PA is not reacting to that particular zone, so we need to evaluate each tick in the candle as it hits the zone.
so what else can add to the confluence of the zone? pattern completions, orderflow weakness, and often trendlines.
for me I only pull trigger if I see price reacting in a way that I recognize in that zone. this for me is mainly instinctual cuz you can see the fight that is occurring in these places.
in the chart I have 1 example of an ABCD pattern leading into Demand zone... trade it man and let it play out if u don't take the trades u wont learn from em
{quote} What's your stoploss size? I see you've been posting EU H4 charts lately. As you know, EU has been extremelly bullish these days. Since the orderflow is telling you the trend is bullish you should only be taking agressive C trades (61.8 or 50.0 retracements) only in the direction of the uptrend. You might help yourself with a moving average to see that or simply trace some trendlines in your chart. I must be honest, I've been shorting the EU this week but only after I see some AB = CD completions and I'm satisfied with the style of swing...
Ignored
Nice post but I will ask that we learn to read the chart stay away from indicators. They build bad habits and make traders lazy. They have zero value and do not offer you anything that you should not already know.
{quote} The problem is i don't understand the order flow and where the big players moving the market.
Ignored
Watch the video I posted on the topic, post a detail question but you must do the work. Do not waste your time looking at other videos. I'm not saying my way is the best it's just my way is unique and there is a lot of crap out there that simply doesn't work.
When you come across something on the net or somewhere else, take the time to validate it's strength or weaknesses also the efficiency of the tool or rule you are considering. Remember there is a 90% failure rate in this business which mean the large majority of the information out there is crap or everyone would be rich.
Ok this is what I'm talking about. On range days I get spooked out at the boundaries. The approach always looks so strong which makes me hesitate and then I miss my trades. In this case we haven't quite gotten to the support I want to see tested. This makes me leary of a trap but we have short term orderflow changing, we have small structural arguments. we have failure to go lower after great projection. BUT we have agressive selling into this area. We have a small range so buying at the bottom against current middle term orderflow into R overhead...
Ignored
Ok I will address ranges this week but it will help you to have all this worked out ahead of time. Trying to come up with all these answer in really time is inefficient and not the right way to do this as you do not have the luxury of time on the lower time frames. Have an expectation wait for price to come to you asses strength or weakness and make a decision. then manage your trade accordingly.
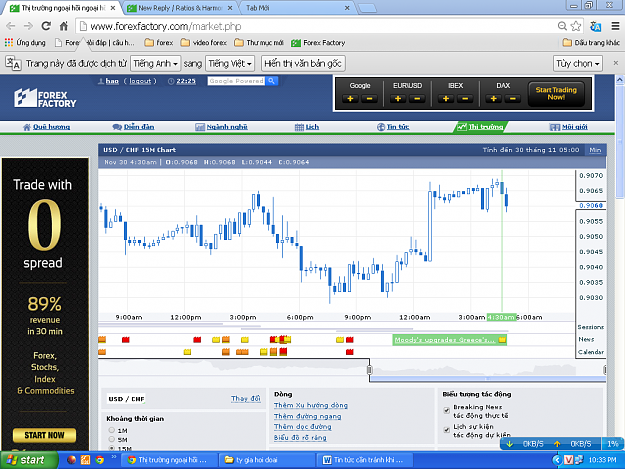
USDCHF monthly fails to break 61% fib. So as per my analysis i see @5543 as per abcd pattern. Correct me if i am doing wrong analysis. This is how I am doing with Harmonic strategy. {image}
Ignored
What kind of trader are you? This is a question we all need to ask ourselves. If you are a trader that likes to take profit on a daily basis then figure out the correct time frame for your style of trading. it is pointless to look at a daily or weekly chart is you are a short term trader. I see many traders over analyze and completely over think a simple process. Learn to read the chart on the time frame you feel comfortable trading. Everything you need to know is there on your chosen time frame. The order flow on the 4H, daily or weekly are completely irrelavent if you are trading on a 15M chart.
{quote} apology , my misunderstanding, I though you were entering the aggressive C sell of the AB leg for the completion of ABCD Anyway , been reading the thread and I reached page 150 and saw a post by Mr.Pip and it has the same price action and order flow movement as the AUD/USD 1H chart that Mr.Pip used in the last order follow video but in this time its the 5M chart which can show how price action and harmonic movement are repeatable over and over again Thank you Mr.Pip {image}
Why doesn't matter. The only thing that does is What?
There are only two question that you need to ask yourself:
What does this mean?
What do I expect price to do next?
You should never take a trade if you cannot answer both of these questions based on the facts of information that the chart is providing you with. The why is information that is not needed to take a trade. That is a question you should ask yourself after the trade has concluded and you are examining the outcome.