{quote} Hello, Lets keep in mind the S/R or S/D are not lines, they are areas or zones. It is best to include tales and opens or closes also small areas of congestion make for good zones as well. I tell you what grab a chart anyone and any timeframe and identify to the best of your ability these zones. I will then comment and expand on the topic if needed.
Ignored
Hi Mr. Pip,
thanks for taking time to look at and explain the supply demand zones.
I'm not on cue, my business delays.
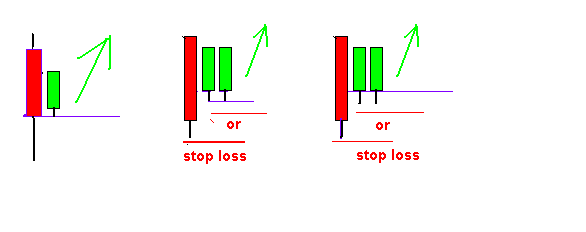
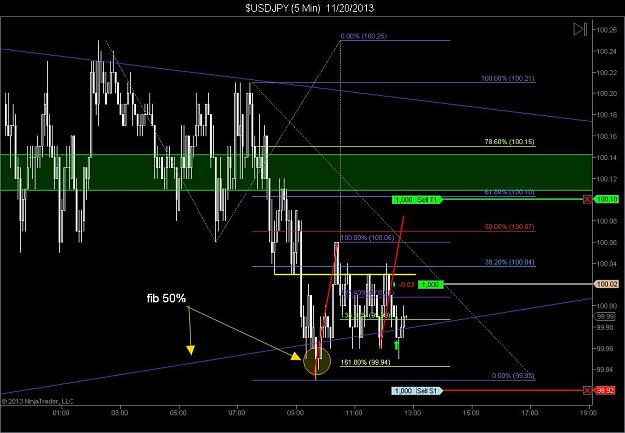
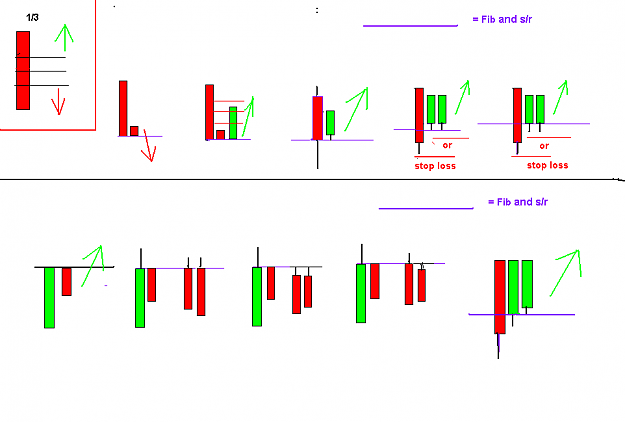
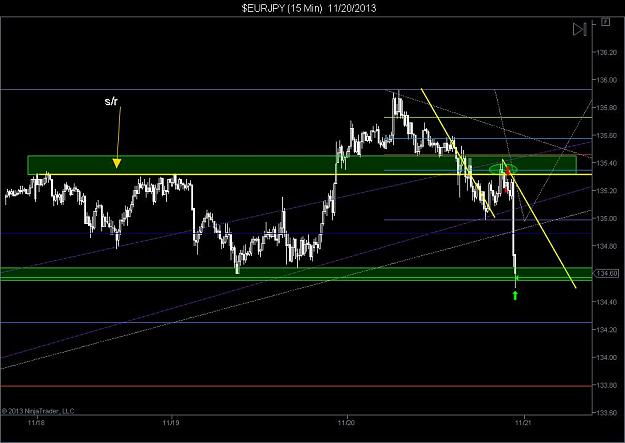
( 50% fib in PRZ )
candle Close on the Fib 50% straight line, draw conclusions:
- randomly removed
- Unauthorized adjustment should exceed the longest candle. ( or trees should be respected longest Fib. )
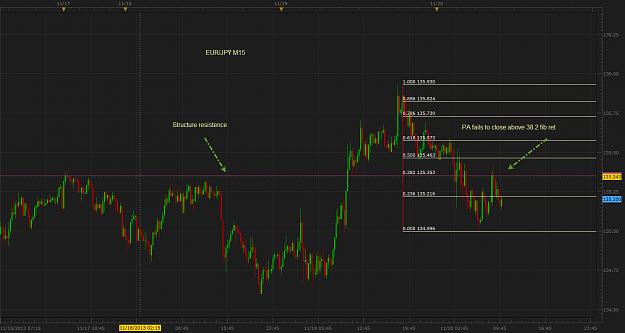
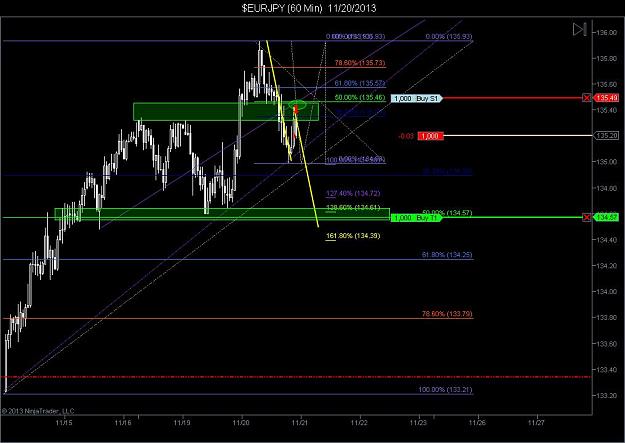
Thanks hao for your comments on model, now am reading your posts from yesterday about price action and candle closing below or above fib and support or resistance
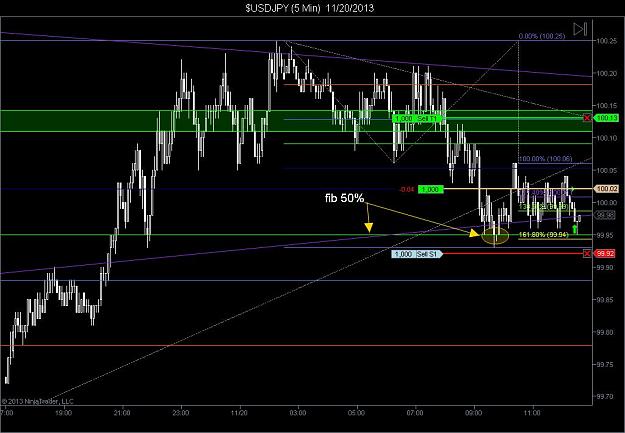
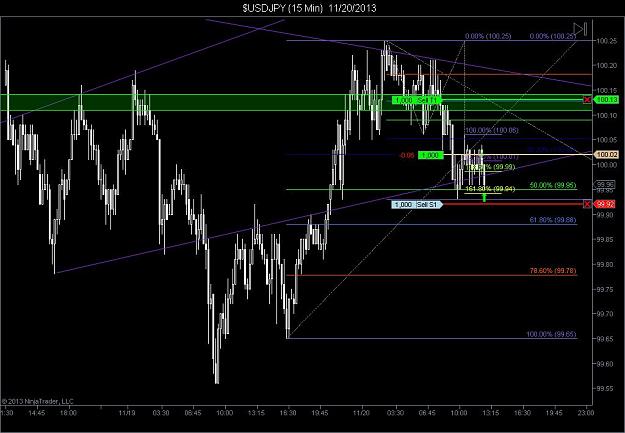
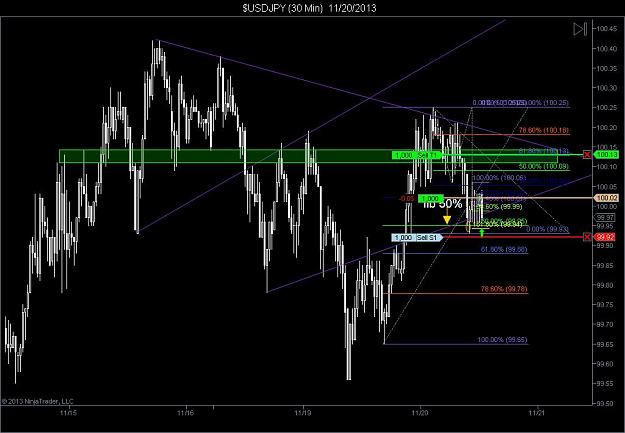
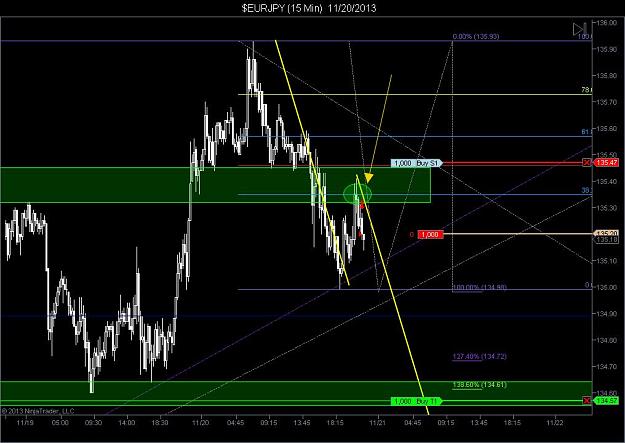
So what I understand is that from your last trade on EUR/JPY is that when pa fails to close beyond fib retracement as in 38.2 example, lining that with structure looking left on your EUR/JPY chart, we have a valid entry
I think if its possible to shed some more light on this interesting subject
Attached Image (click to enlarge)
I Have Learned to Take Some Losses to Make Profits
{quote} Thanks hao for your comments on model, now am reading your posts from yesterday about price action and candle closing below or above fib and support or resistance So what I understand is that from your last trade on EUR/JPY is that when pa fails to close beyond fib retracement as in 38.2 example, lining that with structure looking left on your EUR/JPY chart, we have a valid entry I think if its possible to shed some more light on this interesting subject {image}
Ignored
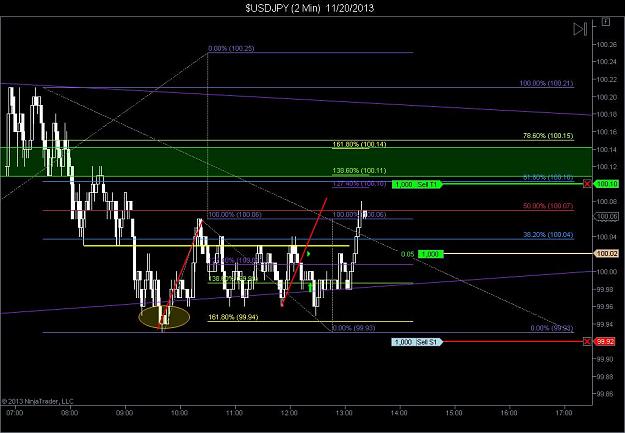
Fib price could pass and then return Fib respect. you can choose 1 of 2 stoploss. you feel comfortable, I like the closest stop loss.
{quote} Thanks hao for your comments on model, now am reading your posts from yesterday about price action and candle closing below or above fib and support or resistance So what I understand is that from your last trade on EUR/JPY is that when pa fails to close beyond fib retracement as in 38.2 example, lining that with structure looking left on your EUR/JPY chart, we have a valid entry I think if its possible to shed some more light on this interesting subject {image}
Ignored
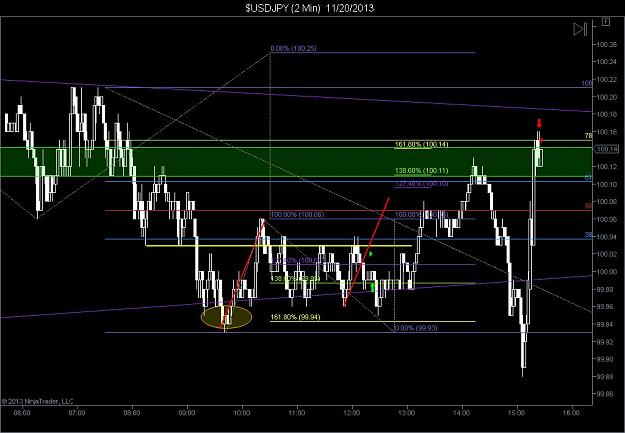
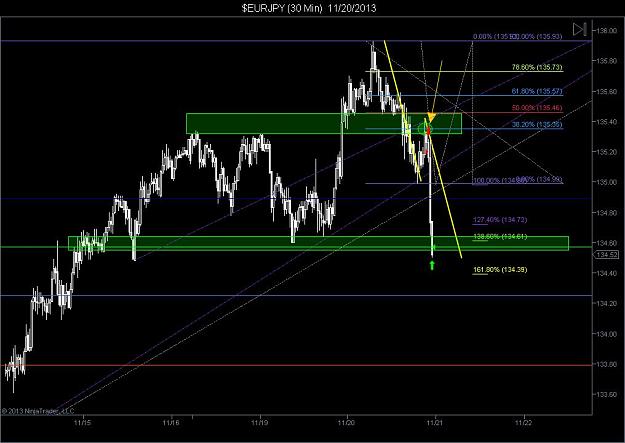
s / r you would be wrong, S / R have candles support multiple in a straight line. if you draw on H1, you are required to watch m15. m15 does not allow candles in violation of S / R or Fib. M30 => m5, h4 = M30 .... its rigorous requirements.
you should not forget to signs reversal of he PIP.
i'm sorry !!!
Ignored