Hi Fui Yong,
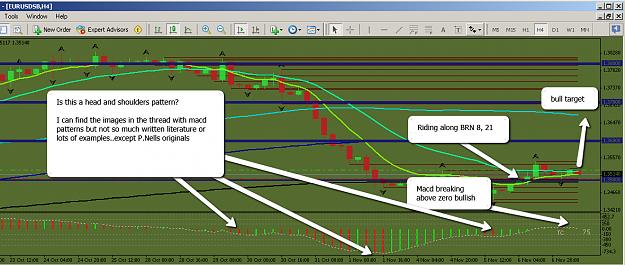
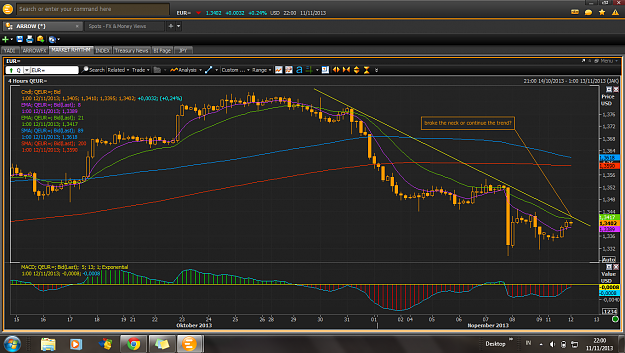
How are you? The EUR is facinating ya
Just hit the news:
"The euro hit session highs against the dollar and yen on Wednesday, with traders citing a Market News report saying a rate cut by the European Central Bank was unlikely despite a drop in inflation."
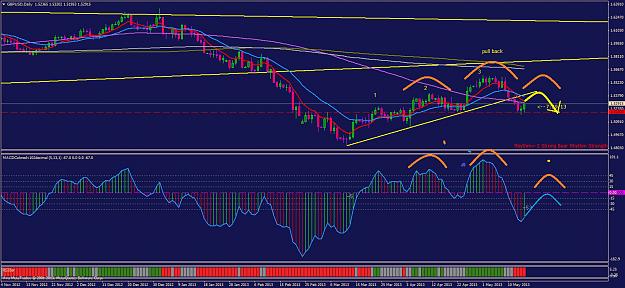
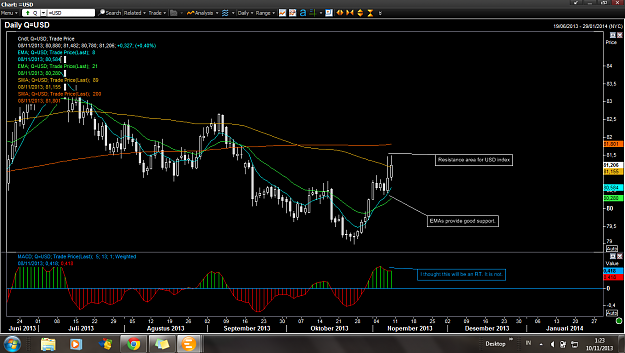
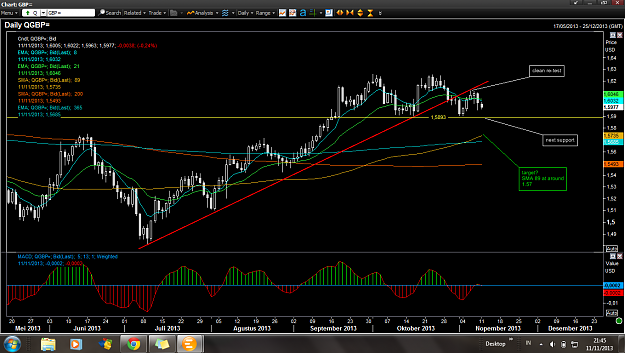
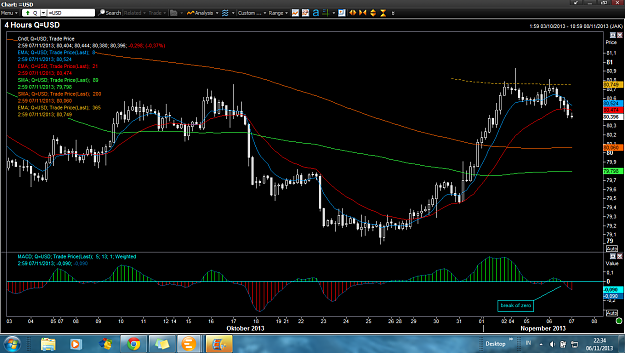
I have not taken the trade. Taking the GU instead after looking at the USDindex chart LoL
How are you? The EUR is facinating ya
Just hit the news:
"The euro hit session highs against the dollar and yen on Wednesday, with traders citing a Market News report saying a rate cut by the European Central Bank was unlikely despite a drop in inflation."
I have not taken the trade.
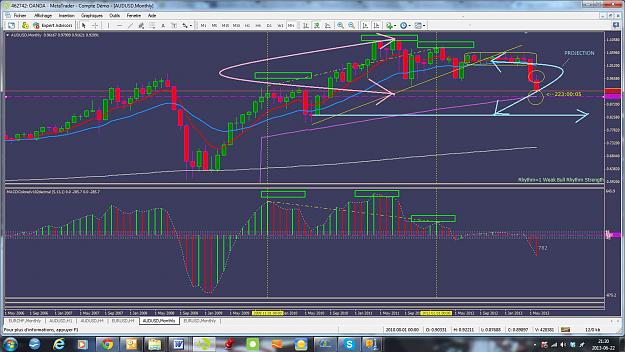
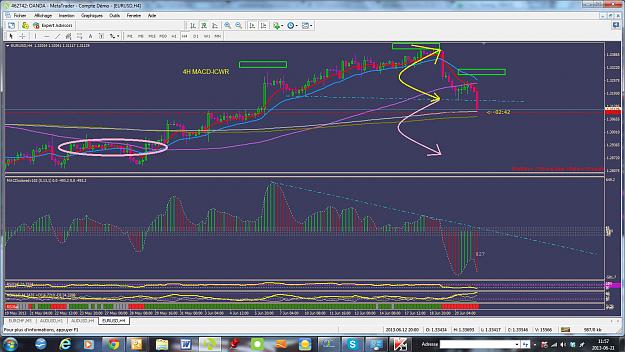
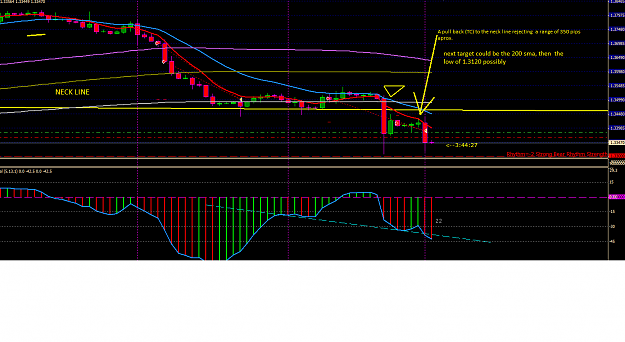
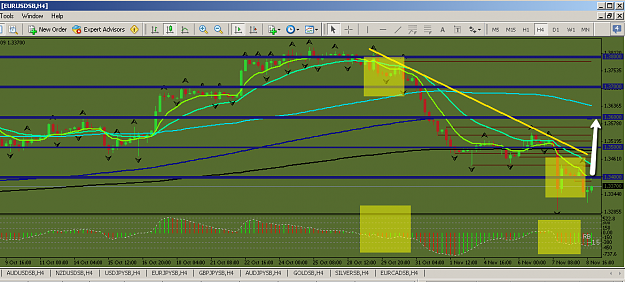
Attached Image (click to enlarge)
Own your own mind.