Thomaas, I would like to add to your first post. I call it:
Fine Tuning Line Placement
Has to have a Leg-in, Base, Leg-out( a "leg" is a large candle with more than 50% of the whole range [meaning shorter wicks] the "base" is a candle with 50% or less than the range [meaning longer wicks] can have one candle)
For "demand" or "supply" trades start at current price on your 1hr chart
Look left and up for fresh supply, or left and down for fresh demand
Leg candles have to be exciting(explosive especially the leg-out) usually very large candle
Base candles are going to be boring and have no direction and price is not moving around much
Once you find these candles, Draw a vertical line straight thorough the leg-in and leg-out
Make sure leg-out is explosive, BE PICKY!
Now calculate the range in the base, (Highest candle wick - the Lowest candle wick )
Then calculate the (Highest Body High - Lowest Body Low)
Divide the Base by the Range
Is the body of the base less than or equal to 50% of the range?
If the body is 50% or less then you have a good strong zone.
If more than 50% then NO BASE NO ZONE!
Now Place two horizonal lines to mark this zone
First line (closest to price) will be placed at the highest high of the Bases body for Long Trade or lowest low of the Bases Body for Short Trade
Second line will be placed at the bases lowest candle wick for Long Trade or Highest wick for Short Trade
Have your stop set above your second line for a short trade spread x3
Have your stop set below your second line for a long trade spread x3
Thats it for fine tuning let me know if there is any confusion. I will do my best to explain more.
Hi Gilamonster,
Thank you for "Fine Tuning Line Placement" English is not my first language, if you can put a chart with your explanation will be greet.
Thomaas, I would like to add to your first post. I call it: Fine Tuning Line Placement Has to have a Leg-in, Base, Leg-out( a "leg" is a large candle with more than 50% of the whole range [meaning shorter wicks] the "base" is a candle with 50% or less than the range [meaning longer wicks] can have one candle) For "demand" or "supply" trades start at current price on your 1hr chart Look left and up for fresh supply, or left and down for fresh demand Leg candles have to be exciting(explosive especially the leg-out) usually very large candle...
Ignored
thank you very much Gilamonster
but you can explain that with pictures my english i bad
Hello guys, if u see any potential level in any pairs pls notify the house, so that others can benefit from the move as well.So what do you think about eurnzd 4hrs tf?
and after reading this thread i start to look at the chart
i found a lot of good trades
but i also saw something not good
i will show it to you and please till me if i am wrong or if there is something that i am missing
look to the attached chart
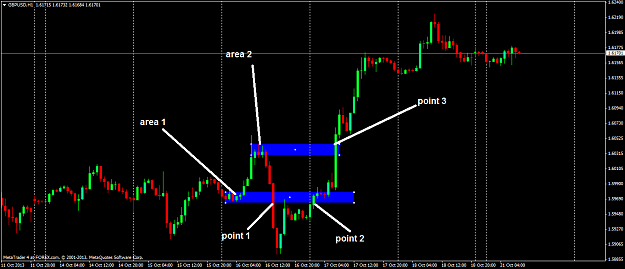
gbp/usd last week
- (area 1 ) formed and considered as demand level
- the price get back to (area 1 )at ( point 1 ) so any one will buy from here will hit the stop loss ( 1st stop loss )
- i read somewhere that any demand or supply level get broken and then get retested >>> the retest point is a good trade so some bod will go short from point 2 and it also will hit the stop ( 2 Nd stop )
- then( area 2) formed and become a supply level and the price come back to it AT ( POINT 3 ) so we will sell and the stop loss will be hit ( 3rd stop loss )
i like this method and after reading this thread i start to look at the chart i found a lot of good trades but i also saw something not good i will show it to you and please till me if i am wrong or if there is something that i am missing look to the attached chart gbp/usd last week - (area 1 ) formed and considered as demand level - the price get back to (area 1 )at ( point 1 ) so any one will buy from here will hit the stop loss ( 1st stop loss ) - i read somewhere that any demand or supply level get broken and then get retested >>> the retest...
Ignored
As I said in my first post, don't expect all the levels to work. Some won't. It's not a 100% success technique.
Anyway, about your levels:
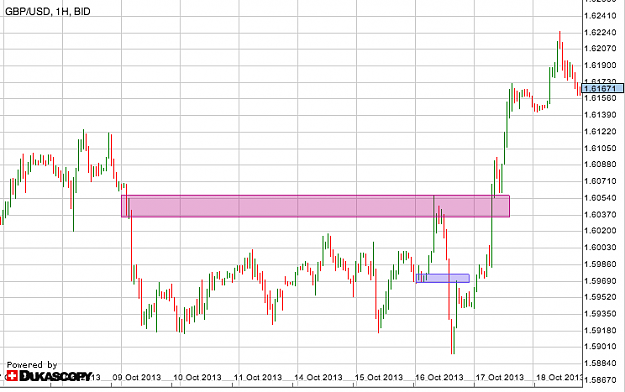
- The bottom one: the price movement is not really strong, so it's not a good level for me.
- The top one: this was a good level. But if you look in past data, you'll see that this level is not fresh, it was already tested a few days ago (see below). So it's not a good level either.
i like this method and after reading this thread i start to look at the chart i found a lot of good trades but i also saw something not good i will show it to you and please till me if i am wrong or if there is something that i am missing look to the attached chart gbp/usd last week - (area 1 ) formed and considered as demand level - the price get back to (area 1 )at ( point 1 ) so any one will buy from here will hit the stop loss ( 1st stop loss ) - i read somewhere that any demand or supply level get broken and then get retested >>> the retest...
Ignored
The failed trades would have been taken when the price level is hit and on an open candle, anything can happen when candle is still open. SD areas are no different than any other key level (eg RN, fib, trendline etc etc) look to trade the reaction to those levels.
Have another look at your same chart and instead of picking a level and just saying you'd place a trade there look for the reaction to that level, what did the (closed) candles do?
Hello guys, if u see any potential level in any pairs pls notify the house, so that others can benefit from the move as well.So what do you think about eurnzd 4hrs tf?
Ignored
Hi,
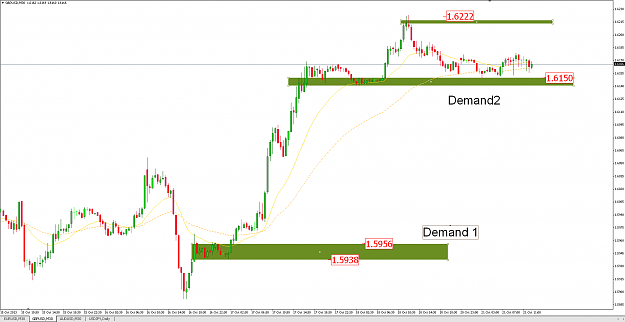
These are the levels i see today, though i don't know if they will get hit today. Hope this hepls and would be interested to know any thoughts or opinion. Good luck with your trading.
Joined Dec 2009
|
Status: I'm not a guy...
|240 Posts
Hi Thomaas. I see that you used some images from an article I wrote for Read the Market. You're very welcome to use the entire article if you wish. In fact, there's a wealth of information on the site which will take learners far beyond the rudimentary use of supply and demand. As a courtesy though, be sure to credit RTM for any material you copy. Thanks so much
Mel
{quote} None, cause it's all the same, there is noise everywhere.NOISE IS EVERYWHERE...and most importantly you do not get them that OFTEN (even if you have some bad ones with you).
Ignored
I've tried explaining this to folks as well. It's amazing how almost none of them have been able to get their mind around the fact that a chart's time periods are only a man-made construct that has no bearing on the price whatsoever.
I like the detail with which you have presented the theory. Keep in mind that this has been taught by Sam Seiden of OTA but it is good to have someone detail it again with future additions, updates, actual trade results and so on. So I am subscribed to your thread and look forward to reading more.
i like this method and after reading this thread i start to look at the chart i found a lot of good trades but i also saw something not good i will show it to you and please till me if i am wrong or if there is something that i am missing look to the attached chart gbp/usd last week - (area 1 ) formed and considered as demand level - the price get back to (area 1 )at ( point 1 ) so any one will buy from here will hit the stop loss ( 1st stop loss ) - i read somewhere that any demand or supply level get broken and then get retested >>> the retest...
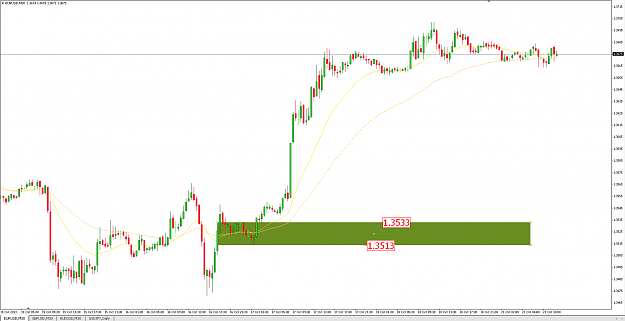
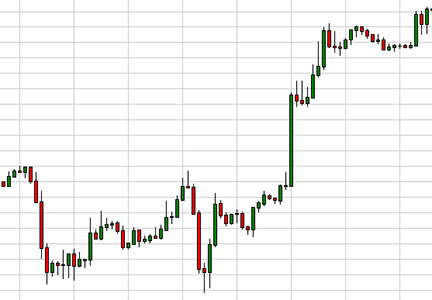
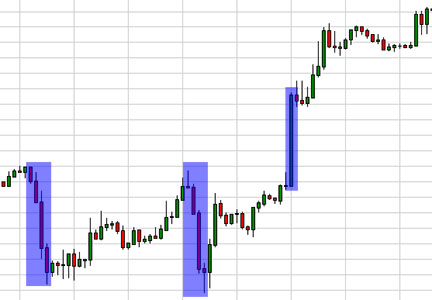
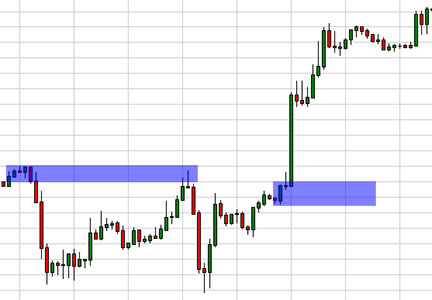
I think my explanations are not clear enough, since a lot of people have trouble with finding levels. Here's a new explanation below. Step 1, find a chart, 1h TF. Here it's EUR/USD. {image} Step 2, identify STRONG price movement. We can see there are 3. {image} Step 3, find the base of the price movement. We see two levels: one that already worked, and a new one. {image} Does it make more sense? {quote} Sorry about that, a friend gave me the "drop base drop" images without telling me the source. Thanks for the offer, but I'm going to upload my...