• Home
  • Forums
  • Trades
  • News
  • Calendar
  • Market
  • Brokers
  • Login
  • Join
  • User/Email: Password:
  • 3:29am
Menu
  • Forums
  • Trades
  • News
  • Calendar
  • Market
  • Brokers
  • Login
  • Join
  • 3:29am
Sister Sites
  • Metals Mine
  • Energy EXCH
  • Crypto Craft

Options

Bookmark Thread

First Page First Unread Last Page Last Post

Print Thread

Similar Threads

Price movement as a function of Supply and Demand 43 replies

Supply and demand zones and EW principles 1 reply

How Markets Work, in a Nutshell! 32 replies

  • Commercial Content
  • /
  • Reply to Thread
  • Subscribe
  • 5,235
Attachments: Supply and demand in a nutshell by Alfonso Moreno
Exit Attachments

Supply and demand in a nutshell by Alfonso Moreno

  • Last Post
  •  
  • 1 119120Page 121122123 485
  • 1 Page 121 485
  •  
  • Post #2,401
  • Quote
  • Sep 13, 2013 10:28am Sep 13, 2013 10:28am
  •  aprilnparker
  • | Joined Oct 2012 | Status: Member | 48 Posts
Hi Alfonso,

I just couldn't get up at 4am to attend a live webinar, I tried but failed and feel asleep. Perhaps I can next time. Any chance that it was recorded?

April
  • Post #2,402
  • Quote
  • Sep 13, 2013 11:20am Sep 13, 2013 11:20am
  •  Olarion1975
  • Joined May 2010 | Status: Senior Member | 1,010 Posts
Quoting aprilnparker
Disliked
Hi Alfonso, I just couldn't get up at 4am to attend a live webinar, I tried but failed and feel asleep. Perhaps I can next time. Any chance that it was recorded? April
Ignored
Hi, it was recorded and will be uploaded to Youtube later.
  • Post #2,403
  • Quote
  • Sep 13, 2013 11:32am Sep 13, 2013 11:32am
  •  nunez1
  • | Joined May 2012 | Status: Member | 101 Posts
Quoting Reacto
Disliked
Thanks Alfonso, it's clear. On my chart, an other broker, the level above was not touched by as much as 59 pips, but I did not take into account the fact that there was too much trading. So we don't draw levels we do not want to take?
Ignored
http://my.jetscreenshot.com/demo/20130913-osvq-105kb can somebody tell me why the supply area on audcad on the 4H tf is not on platform,i guess i need to fix it but i dont know how
  • Post #2,404
  • Quote
  • Sep 13, 2013 11:36am Sep 13, 2013 11:36am
  •  Axlz
  • | Joined Jul 2013 | Status: Member | 431 Posts
Quoting nunez1
Disliked
{quote} http://my.jetscreenshot.com/demo/20130913-osvq-105kb can somebody tell me why the supply area on audcad on the 4H tf is not on platform,i guess i need to fix it but i dont know how
Ignored
If you're referring to the unfilled, green supply level on your chart, refer to this:

COLOR CODES FOR RECTANGLES I USE ON MY CHARTS:
No matter which timeframe I'm using, these are the color codes I use:

  1. BROWN = fresh supply zone
  2. DARKGREEN = non-fresh supply zone, but I will watch it in case I want to have a short on a 2nd pullback
  3. UNFILLED BROWN or DARKGREEN = supply zone I will not use, but I want to have it on my charts to see areas I want to see broken and/or reaction to it
  4. BLUE= fresh demand zone
  5. DIMGREY= non-fresh demand zone, but I will watch it in case I want to have a long on a 2nd pullback
  6. UNFILLED DIMGREY OR BLUE = demand zone I will not use, but I want to have it on my charts to see areas I want to see broken and/or reaction to it
  7. PURPPLE = area I don't trust because of not a clean formation or "diddle in the middle" area. But I want to see how price reacts to it and learn from i

  • Post #2,405
  • Quote
  • Sep 13, 2013 12:10pm Sep 13, 2013 12:10pm
  •  nunez1
  • | Joined May 2012 | Status: Member | 101 Posts
Quoting Axlz
Disliked
{quote} If you're referring to the unfilled, green supply level on your chart, refer to this: COLOR CODES FOR RECTANGLES I USE ON MY CHARTS: No matter which timeframe I'm using, these are the color codes I use: BROWN = fresh supply zone DARKGREEN = non-fresh supply zone, but I will watch it in case I want to have a short on a 2nd pullback UNFILLED BROWN or DARKGREEN = supply zone I will not use, but I want to have it on my charts to see areas I want to see broken and/or reaction to it BLUE= fresh demand zone DIMGREY= non-fresh demand zone, but I...
Ignored
thanks Axlz i was referring to the gray area
the question was why i dont have it on my h4 tf
  • Post #2,406
  • Quote
  • Sep 13, 2013 12:12pm Sep 13, 2013 12:12pm
  •  Axlz
  • | Joined Jul 2013 | Status: Member | 431 Posts
Quoting nunez1
Disliked
{quote} thanks Axlz i was referring to the gray area
Ignored
I see. Well, at least you've got your answer now.
  • Post #2,407
  • Quote
  • Sep 13, 2013 12:16pm Sep 13, 2013 12:16pm
  •  Axlz
  • | Joined Jul 2013 | Status: Member | 431 Posts
Quoting nunez1
Disliked
{quote} the question was why i dont have it on my h4 tf
Ignored

And right click your chart, go to indicator list, select the Supply and Demand indicator, go to visualization, and make sure all timeframes are selected.

As far as I can tell, that picture is showing the 4H TF. That DimGrey Unfilled area = demand zone I will not use, but I want to have it on my charts to see areas I want to see broken and/or reaction to it.

I'm not sure I understand your question?
  • Post #2,408
  • Quote
  • Sep 13, 2013 12:27pm Sep 13, 2013 12:27pm
  •  nunez1
  • | Joined May 2012 | Status: Member | 101 Posts
Quoting Axlz
Disliked
{quote} And right click your chart, go to indicator list, select the Supply and Demand indicator, go to visualization, and make sure all timeframes are selected. As far as I can tell, that picture is showing the 4H TF. That DimGrey Unfilled area = demand zone I will not use, but I want to have it on my charts to see areas I want to see broken and/or reaction to it. I'm not sure I understand your question?
Ignored
http://my.jetscreenshot.com/demo/20130913-y7ps-69kb on this picture post it before it has a gray are on the top rigt close to the green area,my question is i dont have that gray area on my platform.
and i did select all time on the supply and demand indicator but still not showing the gray area
  • Post #2,409
  • Quote
  • Sep 13, 2013 12:29pm Sep 13, 2013 12:29pm
  •  Axlz
  • | Joined Jul 2013 | Status: Member | 431 Posts
Quoting nunez1
Disliked
{quote} http://my.jetscreenshot.com/demo/20130913-y7ps-69kb on this picture post it before it has a gray are on the top rigt close to the green area,my question is i dont have that gray area on my platform. and i did select all time on the supply and demand indicator but still not showing the gray area
Ignored
That area is a speedbump. Speedbumps are not drawn by the automatic supply and demand indicator, you have to draw them yourself.

Whoever's picture that is, he drew that level himself.

I suggest you learn how to draw the levels manually. The automatic indicator makes mistakes sometimes, and does not draw speedbumps, only valleys and peaks.
  • Post #2,410
  • Quote
  • Sep 13, 2013 12:33pm Sep 13, 2013 12:33pm
  •  nunez1
  • | Joined May 2012 | Status: Member | 101 Posts
Quoting Axlz
Disliked
{quote} That area is a speedbump. Speedbumps are not drawn by the automatic supply and demand indicator, you have to draw them yourself. Whoever's picture that is, he drew that level himself. I suggest you learn how to draw the levels manually. The automatic indicator makes mistakes sometimes, and does not draw speedbumps, only valleys and peaks.
Ignored
thank you
  • Post #2,411
  • Quote
  • Sep 13, 2013 2:25pm Sep 13, 2013 2:25pm
  •  markot
  • | Joined Dec 2009 | Status: Member | 64 Posts
Good day traders,
First of all I wish to thank Alfonso for opening this thread, and hopefully it will stayed opened.
I am trading S/D strategy for more than 2 years, and same as Alfonso, I had to research myself in order to filter S/D levels. I will try to contribute as much as I can, and present some of my researches, and ideas as well. I hope that u will find them useful.
I have watched many webinars held by S Seiden, and he is frequently talking about odd enchanters. Here are some of my own:

1. TRADING PLATFORM

You may wonder why a trading platform would be an odd enchanter. In his webinars, Sam was talking about trading futures market, not Interbank market –known as Forex. In a regulated market, such as futures, all participant see the same price . Since our trading is based on a same pattern ( Alfonso explained that in first post of this thread) , it is clear that candle formation inside basing area is most important to us, as well as departure from it. On some platforms , u may find doji when on the other u won’t find it, this could bring doubts about the quality of our zones . Also, not every platform has the same closing time of a candle, therefore it could mislead you how high or low u have to put your proximal or distal line. Of course, we do add few more pips from both sides ,but nevertheless this becomes an issue and the result could lead us in missing our trades.
2.COT REPORT

I believe this is the most useful tool in our trading. Every Friday around NY close Futures commission announces commitment of traders / COT report. You can find it here : http://www.cftc.gov/marketreports/co...ders/index.htm , and historical COT look in here : http://www.cftc.gov/MarketReports/Co...able/index.htm .
I have attached a word file which will explain how u can benefit from reading COT report . In short, it is used on a longer time frame ( such as daily and weekly) , and can help us determine where could we possible expect the market turning point. Market is composed of three groups: commercials, non-commercials and small speculators. Commercial are also known as hedgers, and they are in the game especially to hedge against the risk to protect their prime business ( such as airplane companies, car companies and others… ) , they are not interested in speculating. Therefore, they are usually most bullish near the bottoms, and most bearish near the tops. Non-commercial are large speculators, and they are in the game for profit. Usually they are right about direction , and they are opposite to commercials(this group is interesting to us). Small speculators are all the others, which are usually wrong in directional trading.
Now the question : Where do u think the largest spread between commercial and non commercial would be ??
You got it right. Near or at our S/D levels!
Here u can find an useful site which regularly updates COT reports and offers charts : http://www.timingcharts.com/

3. DOLLAR INDEX

Sam Seiden is always looking at dollar index, and he never goes against it. Still, dollar is prime currency and watching what the dollar is doing is very beneficial. Around the world, in order to buy some currencies, u must first buy dollars and then buy the other currency with the dollars. It is done this way. Of course, u already know that the cross pairs are derived from major currencies which all have dollar, ether as base or quote. For example EUR/CHF = (EUR/USD)*(USD/CHF). You can find live dollar index at www.netdania.com , u can try their net stations with a free demo account. There are also other indexes, which u may find useful.

4.Spread indicator

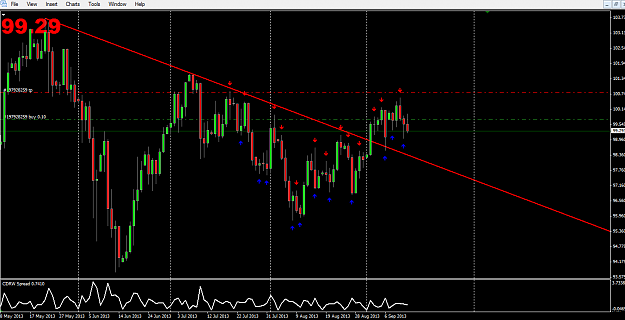
I have come across a very handy indicator which monitors the spread widening , and I find it useful in order to check if arrival to my level is appropriate, as well as departure from the level. Sam said that spread widening near S/D levels is good because broker would not like us to buy or sell there. I have attached this indicator.

Indicator is easy to use, and u can set the number of bars counted in history . It works on any Period.
I also like to use period separator , as it give me a quick overview of the week range ( OHLC) if I am trading on a H4 TF, and if I am looking at daily it gives me monthly OHLC. Very handy

5. ATR

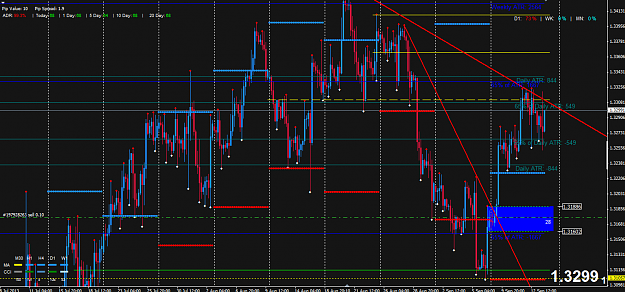
Also a very handy indicator which helps me easily track the average true range , set on weekly/ daily 100 periods. Usually around those lines are our S/D levels. I use it on H4, and it serves me as a confluence. When a price is moving up or down, the indicator is dynamic and starts from the week beginning . If the price is moving in one direction, either up or down, the opposite side of a price is being adjusted, while the lines in price direction are not moving. It will help u spot S/D levels more easily, but doing analysis is necessary. Do not rely on indicator solely , because its prime function is to show what is the average true range of specific period of time.

The blue lines are Weekly ATR, and somewhat green is Daily ATR. Of course, if u are bothered with to much crowdie chart, u can always turn it off and use it when u are doing r analysis. The 65% is nothing more than 65% move of the 100 periods of ATR .Sometime it can be used as profit target, or to signal that u r entering overbought area if u r long, or oversold if u r short. Again, do not rely solely on this indicator as we r trading pure price action -fresh Supply and Demand level. Still, u can find it handy. I have also attached this indicator.

P.S
The indicators as well as COT education provided in word office in not my handy work. Those are taken from other sites, but I copy and paste it to avoid marketing. Hopefully no harm is done J


Hope this helps,
Regards

MarkoAttachment 1274364Attachment 1274364
Attached Images (click to enlarge)
Click to Enlarge

Name: atr.PNG
Size: 74 KB Click to Enlarge

Name: Usdjpy.PNG
Size: 48 KB
Attached Files
File Type: ex4 ATR.ex4   7 KB | 259 downloads
File Type: mq4 ATR.mq4   9 KB | 337 downloads
File Type: ex4 SPREAD.ex4   4 KB | 255 downloads
File Type: mq4 SPREAD.mq4   2 KB | 357 downloads
File Type: docx COT report education.docx   1.1 MB | 1,084 download
  • Post #2,412
  • Quote
  • Edited at 3:13pm Sep 13, 2013 2:52pm | Edited at 3:13pm
  •  Axlz
  • | Joined Jul 2013 | Status: Member | 431 Posts
Quoting markot
Disliked
Good day traders, First of all I wish to thank Alfonso for opening this thread, and hopefully it will stayed opened. I am trading S/D strategy for more than 2 years, and same as Alfonso, I had to research myself in order to filter S/D levels. I will try to contribute as much as I can, and present some of my researches, and ideas as well. I hope that u will find them useful. I have watched many webinars held by S Seiden, and he is frequently talking about odd enchanters. Here are some of my own: 1. TRADING PLATFORM You may wonder why a trading platform...
Ignored

In regards, to the COT report, forgive me if I misunderstood this, but I don't see why anyone should consider this when trading.

The forex market is unregulated. We cannot track the orders of the big boys, so I am confused how this report relates to FOREX?

Forex has no centralized exchange, and therefore cannot keep track of any orders/see who is doing what, unless we work for the big banks (liquidity providers).

And even then, the big boys still regularly lose money and make incorrect trading decisions.


If I'm not mistaken, this tells us how many people are short/long in any market. Ok, but 95% of traders lose money over the long term. And like I said, the big boys are not exempt from losing money. They regularly make mistakes.

The last thing anyone should be doing if they want to be successful at trading, is following the herd (not to be confused with not following the prevailing trend direction of the market).


No offence, but This rubbish isn't even worth using for confluence. I doubt any serious/successful trader cares about the COT report.


We should trade purely based on what we know to give us an edge (Technicals), and not screw around with something as worthless and ancient as fundamentals.
  • Post #2,413
  • Quote
  • Sep 13, 2013 3:33pm Sep 13, 2013 3:33pm
  •  jmcl
  • | Joined Jun 2008 | Status: Member | 275 Posts
Why don't Markot open his own thread for people who would like to use indicators. I mean his is welcome to comment on this thread but to budge in with a lot of indicators where Alfonso request was that indicators are not used except for price action candles which is the only not lagging indicator.

Please pay some respect for what this guy are trying to coach us.


John from Durban
  • Post #2,414
  • Quote
  • Sep 13, 2013 3:36pm Sep 13, 2013 3:36pm
  •  tradista
  • Joined May 2011 | Status: - | 720 Posts
The COT report is a very useful information source, good to have in your arsenal, as long as you are trading USD pairs.
  • Post #2,415
  • Quote
  • Sep 13, 2013 4:20pm Sep 13, 2013 4:20pm
  •  Axlz
  • | Joined Jul 2013 | Status: Member | 431 Posts
I've been using this methodology on Forex Tester 2 for the last 2 hours, and it is AMAZING how well it works.

I'm using D1/H4, and I'm loving it. The methodology is excellent. It is our emotions that ruin us during live trades! That is the issue.
  • Post #2,416
  • Quote
  • Sep 13, 2013 4:38pm Sep 13, 2013 4:38pm
  •  Nvrgvup
  • | Joined Sep 2013 | Status: Member | 26 Posts
Quoting Axlz
Disliked
I've been using this methodology on Forex Tester 2 for the last 2 hours, and it is AMAZING how well it works. I'm using D1/H4, and I'm loving it. The methodology is excellent. It is our emotions that ruin us during live trades! That is the issue.
Ignored

Hi Axlz, are you able to use Alfonso's indicators on Forex Tester 2?
  • Post #2,417
  • Quote
  • Sep 13, 2013 5:09pm Sep 13, 2013 5:09pm
  •  Gxp1
  • | Joined Dec 2010 | Status: Member | 93 Posts
Quoting markot
Disliked
Good day traders, First of all I wish to thank Alfonso for opening this thread, and hopefully it will stayed opened. I am trading S/D strategy for more than 2 years, and same as Alfonso,. Hopefully no harm is done J Hope this helps, Regards Marko12743641274364 {image} {image} {file} {file} {file} {file} {file}
Ignored
Markot you have made very important points which any successful trader would consider, infact orderflow traders look at COT reports to get the market sentiment right hence direction.The spread you mention is a manipulative move by smart money and when it appears near the zones take heed. Thanks for your input
  • Post #2,418
  • Quote
  • Sep 13, 2013 5:22pm Sep 13, 2013 5:22pm
  •  panoramia
  • | Commercial Member | Joined Aug 2011 | 3,512 Posts
Quoting markot
Disliked
Good day traders, First of all I wish to thank Alfonso for opening this thread, and hopefully it will stayed opened. I am trading S/D strategy for more than 2 years, and same as Alfonso, I had to research myself in order to filter S/D levels. I will try to contribute as much as I can, and present some of my researches, and ideas as well. I hope that u will find them useful. I have watched many webinars held by S Seiden, and he is frequently talking about odd enchanters. Here are some of my own:
Ignored
Thanks for your contribution Marko, I am sure that many will appreciate it.

As far as the trading platform, it's true that futures give a plain identical price for all assets. Trading forex is a different thing. Having the same price is not going to be possible, because not everybody can has the same broker. Even within the same broker, my limit order might not get filled and your would. This is why I always say the same thing: trade what you see on your charts, trade what you see.

As far as the COT report, I am aware of those. I read about it some time ago, it looked intersting but I thought of it more for a medium/longer term investments. But like I said I am not that familiar with it, but I read a few articles on it. I even located an indicator that showed the COT data under metatrader.

The $index is key to trading forex, we've discussed about it in the thread over and over, it's the first thing I check every morning before opening my live account broker. Then the majors that are part of the $index then the other pairs I track.

As far as the ATR and spread indicator, I am just not using any of those, not even the ADR indicator that I created really. I have been removing indicators from my charts, because an indicator means more rules, more decisions to be taken, thus more indecision to pull the trigger and trade like a robot.

BUT, I must say that they are useful, and that if used with the correct rules, it can be an odds enhancer as well, which is great. Whoever wants to use them, they first need to add those rules, and that's work that needs to be done on the side of whoever wants to implement them.

As far as some comments by some members of the thread, PLEASE do not use "inadaequate" words, words like rubbish and the kind are not allowed in a civilized conversation, even if you don't like what you read or to whom you are referring to. We have to be gentlemen. Marko was just trying to help us with his comments and experiences. We have to be humble enough to reconognize that, you can't attack him or anybody for trying to help us. You may not like what he said or it can also be that you don't know that what he said can be of help to your trading, both things can happen!

We can't say bad things about anybody over here, each of us has its ows goals and purposes, even OTA. They have a business, you like it or not, and well if something is done in the way they don't like, they will try to fix that, as you would with your own business I am sure. I will never say anything bad about anybody, each of us has a reason to exist and to be here on this thread, but please I demand respect for everybody, be it myself, Marko or OTA.

If respect is lost, then everything is lost. So please, bear this in mind before getting your emotions involved or maybe one day it will be too late to say sorry! That's life!
Alfonso
Set and Forget supply and demand trading community
  • Post #2,419
  • Quote
  • Sep 13, 2013 5:56pm Sep 13, 2013 5:56pm
  •  MadCow
  • | Joined Jan 2009 | Status: Member | 109 Posts
Quoting panoramia
Disliked
{quote}As far as the COT report, I am aware of those. I read about it some time ago, it looked intersting but I thought of it more for a medium/longer term investments. But like I said I am not that familiar with it, but I read a few articles on it. I even located an indicator that showed the COT data under metatrader. .... Alfonso
Ignored
I wonder whether the COT might be useful to evaluate the strength of an HTF zone. If the smart money is buying during a week, and a demand zone forms during that same week, that might be an indication that the zone is better than one where the smart money is selling.
  • Post #2,420
  • Quote
  • Sep 13, 2013 6:04pm Sep 13, 2013 6:04pm
  •  panoramia
  • | Commercial Member | Joined Aug 2011 | 3,512 Posts
Quoting MadCow
Disliked
{quote} I wonder whether the COT might be useful to evaluate the strength of an HTF zone. If the smart money is buying during a week, and a demand zone forms during that same week, that might be an indication that the zone is better than one where the smart money is selling.
Ignored
Right now, the way I look and trade the markets does not need of any COT reports. Can it be of any help? Of course it can, but I've never had to use it to make a decision. I was aware of them but I didn't see how exactly I could apply them. If the level is original and fresh, I will take the risk, that's all I can say. I don't care what the COT report has to say, even though it might help. Why not? Because if I add the COT report to my decision process, it will be exactly that, "another" decision to be made, and what I am trying to do is precisely the oppoite, and that is removing variables from my decision process so that by looking for 10-20 seconds at my entry timeframe, I will know what I can do or cannot do.

Is that too simple? Yes it is, and that's why I love it! But I must say that if the COT report is wisely used, it could help I am sure. It's just up to you to use it appropiatedly. I will stick to my simple decision processes, which are not that simple when you are starting, and become as good as anybody can be performing a task, that's my duty as a trader.

Alfonso
Set and Forget supply and demand trading community
  • Commercial Content
  • /
  • Supply and demand in a nutshell by Alfonso Moreno
  • Reply to Thread
    • 1 119120Page 121122123 485
    • 1 Page 121 485
0 traders viewing now
  • More
Top of Page
  • Facebook
  • Twitter
About FF
  • Mission
  • Products
  • User Guide
  • Media Kit
  • Blog
  • Contact
FF Products
  • Forums
  • Trades
  • Calendar
  • News
  • Market
  • Brokers
  • Trade Explorer
FF Website
  • Homepage
  • Search
  • Members
  • Report a Bug
Follow FF
  • Facebook
  • Twitter

FF Sister Sites:

  • Metals Mine
  • Energy EXCH
  • Crypto Craft

Forex Factory® is a brand of Fair Economy, Inc.

Terms of Service / ©2021