Thank U Ralome, this 24 value is very interesting. I'm still trying to apply that value to Fractal Dimension to find something ....
Edited: I must go to sleep now .... thank you all ...
{quote} Thank U cfdtaleong .... {quote} Please correct me if I'm wrong : If DIS-similarity ends => we expect it's begin of Similarity candle (is this right ??) So, it's the time to trade. Because the price will go to where the DIS-similarity appear ... If we know WHEN the similarity will begin, then we must not seat in front of computer all the time ....
Ignored
For your considerations. I may be wrong.
Things you got correct
1)You are right when dissimilarity ends similarity beings.
2)You are also right price will go to where dissimilarity appear.
Things where you may be wrong
1)We won't know when similarity will begin. We can only estimate at best. Your post 4973, the statement you highlighted in yellow. It ends if none of the conditions appear if it happens you wait another 24 candles and if it happens again you have to wait another 24 until such time none of the conditions appears. How then can we know when exactly when dissimilarity will end? Ralome may have misunderstood your question or perhaps I am the one that misunderstand lol.
2)The end of dissimilarity is when you can consider a trade targeting the dissimilarity level but it is not so straight forward. I am very sorry I cannot fully explain it here as there are too many variables. The other similarity may hold answers for you.
Joined Nov 2011
|
Status: Ups and downs
|289 Posts
Cfdtaleong, you're right, but I think it's just semantics, i.e. "we know it'll end after 24 candles if this and this doesn't happen" and "we estimate that it'll end after 24 candles" are very close in my opinion. But I'm sure smallcat got his answer
Even if you fall on your face, you're still moving forward.
Cfdtaleong, you're right, but I think it's just semantics, i.e. "we know it'll end after 24 candles if this and this doesn't happen" and "we estimate that it'll end after 24 candles" are very close in my opinion. But I'm sure smallcat got his answer
The cycle-identifier is a repainting indicator and the least used in the similarity system! The next indicator is the stochastic indicator! This one is SUPER but you need to watch your chart cause once you get the signal, you are in for a big ,,,,,,,,,, lOOK at the two reading in the indicator window! I will explain this approach next week! {image}
Ignored
Is there any programmer willing to code an indicator using just the stochastic method described in this post that can identify similarity from both time frames onto one chart?
Not the BB stoch method, just the Stochastic method.
{quote} For your considerations. I may be wrong. Things you got correct 1)You are right when dissimilarity ends similarity beings. 2)You are also right price will go to where dissimilarity appear. Things where you may be wrong 1)We won't know when similarity will begin. We can only estimate at best. Your post 4973, the statement you highlighted in yellow. It ends if none of the conditions appear if it happens you wait another 24 candles and if it happens again you have to wait another 24 until such time none of the conditions appears. How then can...
Cfdtaleong, you're right, but I think it's just semantics, i.e. "we know it'll end after 24 candles if this and this doesn't happen" and "we estimate that it'll end after 24 candles" are very close in my opinion. But I'm sure smallcat got his answer
Ignored
Thank U Ralome, you are also right ....
------
English is not easy, especially for me .......
Joined Jul 2009
|
Status: Left Leg In, Right Leg Out!
|5,792 Posts
I agree with the treatment that the measure of similarity must be the Bollinger Band setting of 24.
The words similarity/dissimilarity are describing the effect of "congruence" in price across all timeframes:
Similarity = congruence ON
Dissimilarity = congruence OFF
but they are actually talking about the same thing, as opposed to 2 different things to measure. Hence why the 300 bar thing is needed to define the extent to which our eyes can see congruence on a chart. But time is the tricky bit.... because congruence or lack of it needs a measurement also.... hence the 24.
In theory this can be any value really... but the link back to the Bollinger Band gives you a nice visual that when Price or Stoch exceeds the band, then in effect the limit of that 24 period is now being reached..... am i making sense? Hope so!
EDIT:
By the way, for those interested in my boring ramblings, I've opened up a trading journal for Attempt #2 at turning $5K into $50K. Before you ask, it's DEMO! This time I've linked a trading explorer onto it so I'm trying to take it more seriously.
A pip is only worth it if you know how much you risked to earn it
|
Additional Username
|
Joined Jul 2013
|186 Posts
Hi Ralome,
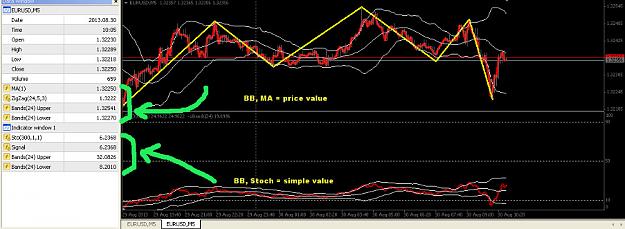
May be this is a kiddy question ... I'm just curious, is it possible to convert the "simple value" of Stoch-BB at lower window to "price value" like BB-EMA at upper window, OR may be convert the "price value" of EMA-BB to "simple value" ?
{quote} Is there any programmer willing to code an indicator using just the stochastic method described in this post that can identify similarity from both time frames onto one chart? Not the BB stoch method, just the Stochastic method.
Ignored
See attached indicator. It only works in real-time, so no history. The default setting is 75 period for the 1-minute chart and compares it to the 5-minute 15 period stochastic.
Hi Ralome, May be this is a kiddy question ... I'm just curious, is it possible to convert the "simple value" of Stoch-BB at lower window to "price value" like BB-EMA at upper window, OR may be convert the "price value" of EMA-BB to "simple value" ? Thanks {image}
Ignored
Yes, it's possible to some extent. How would you like it exactly?
Even if you fall on your face, you're still moving forward.
{quote} Yes, it's possible to some extent. How would you like it exactly?
Ignored
Wow great ... thanks before, Ralome. And sorry, it doesn't mean that i do not appreciate your Rv-1 or Rv-2 indicators, they are great. But i just think that the difference of both indicator (EMA1 with BB24) - lets say the TOP indicators - and (Stoch300,1,1 with BB24) - lets say the BOTTOM indicators - can be clearly seen if we can see the value of indicators as number (ex. via data window). So, if the "price value" of TOP BB24 indicator & EMA1 indicator can be convert to "simple value" like the value of BOTTOM indicators (or the reverse of it), it would very nice.
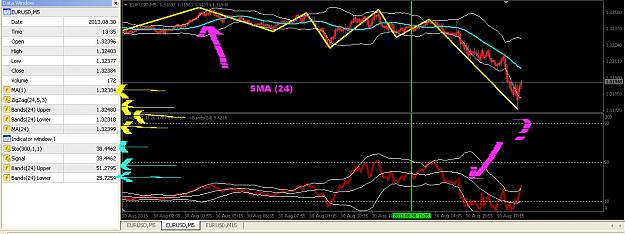
Example: At the picture below, the middle band value of TOP BB i think is the same as SMA24 (close), but i don't know how to get the value of BOTTOM middle band. Form picture we can see, at the specific time (green vertical line), from the data window (left area), the value of EMA1 is (1.32384) , TOP upper band of BB24 (1.32480), TOP lower band of BB24 (1.32318) , and TOP middle band (actually is SMA24) has value of 1.32399, at bottom: value of Stoch300,1,1 (38.4462), BOTTOM upper band of BB24 (51.2795) and BOTTOM lower band of BB24 (25.7254). Lets say the the TOP upper band is converted from 1.32480 => 51.2795 , and TOP lower band is converted from 1.32318 to 25.7254. So, can we convert the EMA1 value from 1.32384 to something like 38.xxxx ? How can we calculate it (there is a deviation of 2 in the BB).? If it is possible, we can compare the "converted EMA1 value" with the value with Stoch300,1,1 (38.4462). May be we need an indicator that show the difference , and in this indicator there is an external double variable , ex: 0.0002 (can be changed). So, if the difference is > 0.0002 , we can define it's a big "enough" difference ( dissimilarity ). And another external double variable, ex: 0.0001 , if the difference < 0.0001 , then we can say that TOP and BOTTOM are similar.
This is just my opinion. I don't know, this will make sense or not, and any idea from you all is welcome .....
{quote} See attached indicator. It only works in real-time, so no history. The default setting is 75 period for the 1-minute chart and compares it to the 5-minute 15 period stochastic. {file}
Ignored
Not sure how we could use this for the proposed method.
Thank you for making the effort and not having posted here before, shame on the rest!
{quote} Is there any programmer willing to code an indicator using just the stochastic method described in this post that can identify similarity from both time frames onto one chart? Not the BB stoch method, just the Stochastic method.
Ignored
Xixi started to write this. No zones yet, just dissimilarity across timeframes! looks interesting!
So, if the "price value" of TOP BB24 indicator & EMA1 indicator can be convert to "simple value" like the value of BOTTOM indicators (or the reverse of it), it would very nice.
finally after 250 Pages and Trial on the templates
i'm ready to make my first post to contribute to the thread
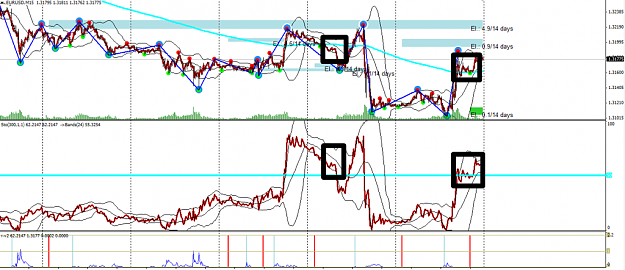
Found the boxes linked with strong future signal, i found if that is a possible way of determining future price direction
As EURUSDD Mentioned before Price leads Stochastic.
Pay attention to the MA 300 Line and compare with the indicator below and see the reaction in the very near future right side of the chart after the black boxes.