{quote} AUD/USD Example. Demand has been absorbed at that level you showed. Price is reacting to the buy orders at the level below your grey one. It just doesn't make sense to me to draw a level that has been absorbed, because the buy orders no longer exist at that level. But again, do what works for you. Where the level stopped short of the blue one (on your chart) i would mark that as fresh and take the first pullback. Price seemed to react accordingly in the example. NT
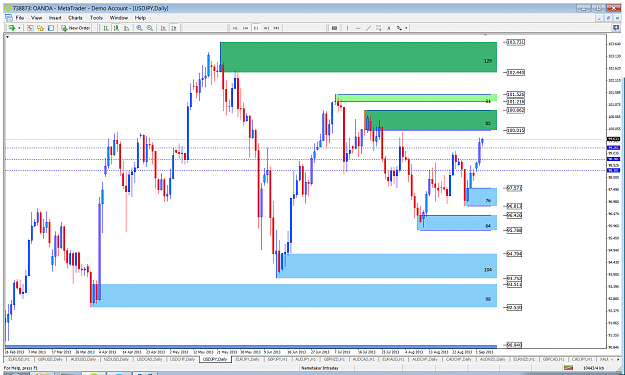
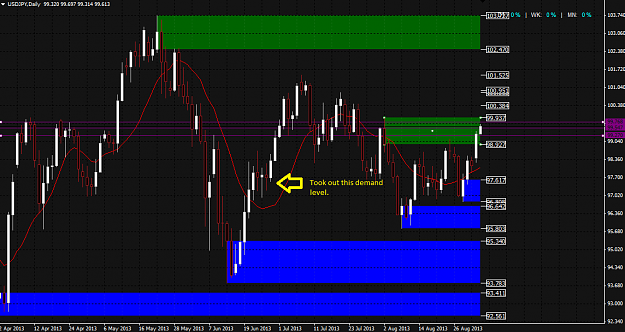
{quote} I asked to post, because I wanted to see if others had the these levels marked. I don't understand why the indi marks the zones (31 and 85 pips) as supply zones. They did not take out any valid demand. However, the valley below the 85 pip zone, did. {image}
Ignored
I dont know what you mean by levels when you refer to pip amount because it doesnt show on your chart. Tell me by the proximal line number.
As for the "demand" level your arrow is pointed out, i wouldnt count that because
1. I consider those dojis when at a swap level/speedbump invalid. They are too weak.
2. Counter trending a speedbump is extremley risky if that level hasnt had previous interactions to confirm its validity. And even then you would need confirmation.
The dimgrey level is the past demand, that price failed to close over.
As we can see, price is not respecting Alfonso's supply level, and is heading towards the level I drew.
Now, two things can happen.
It can bounce off it, or it can keep going through. The level is NOT fresh, as price has already made a large wick over the level, so it has been thoroughly tested, but as we know, price can pullback and a level can hold many times, even if its not fresh.
If price hits my level and bounces down, then we know it was my level still in play.
If not, then it could have just been because my level was not fresh. But then again, Alfonso's level WAS fresh AND original, so it should have worked.
{quote} I dont know what you mean by levels when you refer to pip amount because it doesnt show on your chart. Tell me by the proximal line number. As for the "demand" level your arrow is pointed out, i wouldnt count that because 1. I consider those dojis when at a swap level/speedbump invalid. They are too weak. 2. Counter trending a speedbump is extremley risky if that level hasnt had previous interactions to confirm its validity. And even then you would need confirmation.
Ignored
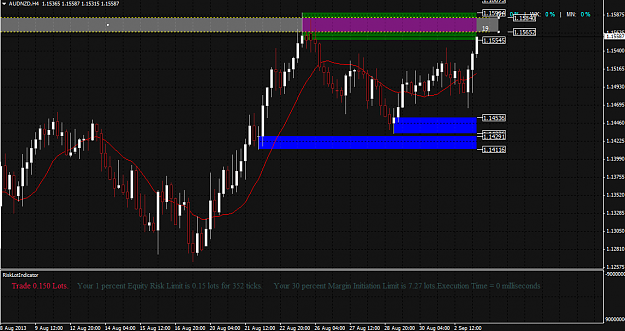
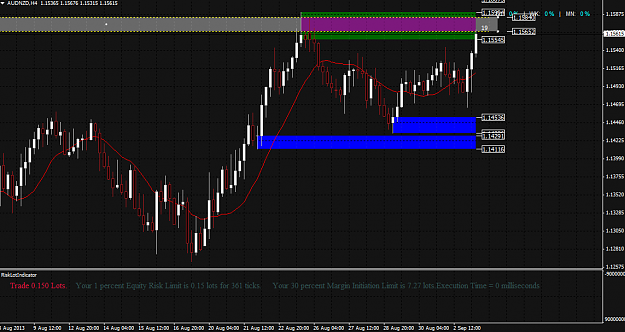
I didn't mean to say that the speedbump was a good level to put orders on. I meant that it is nonetheless, a valid demand area that overtook supply previously, so therefore, the level I marked should be valid supply, as it overtook the valid speedbump. Not to be confused with the speedbump being a good place to place trades (as it is countertrend).
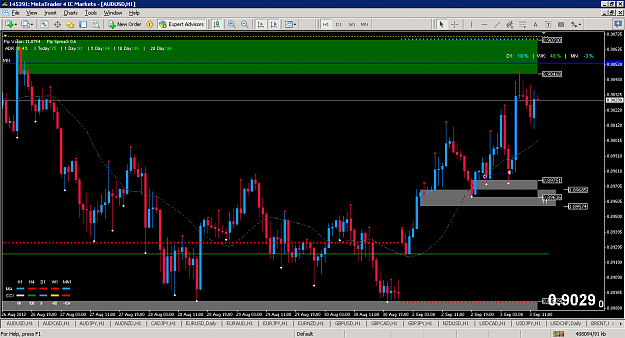
Here is a good experiment for us all: {image} The green level is Alfonso's supply level. The dimgrey level is the past demand, that price failed to close over. As we can see, price is not respecting Alfonso's supply level, and is heading towards the level I drew. Now, two things can happen. It can bounce off it, or it can keep going through. The level is NOT fresh, as price has already made a large wick over the level, so it has been thoroughly tested, but as we know, price can pullback and a level can hold many times, even if its not fresh. If...
I haven't been very active since the week started. I am disconnecting more and more every day and letting the markets do what they want to do. The best thing I can do is walk away and let the markey dynamics move towards my entries.
I disconnected yesterday a few hours after London Open, climbed for a few hours and didn't look at the charts till now. I have to take a flight back to my city in a couple of hours and will get organized for the rest of the week.
I just loaded my H1 and H4 Metatrader account, no triggers on my H4 account, but 3 triggers on my H1 account. I had a loss trying to buy the S&P 500 towards supply, but well that's part of the game.
As I explained in a previous post, I do have 2 accounts, one for trading purely H1/D1, and a second one for H4/W1. I will be adding a third account to trade full D1 SD levels, that is, Monthly as the curve timeframe and D1 for entries. Stop losses will be bigger, but the profit targets as well. I just don't want to mingle with results, become more patient and let the tools I am building for personal use (based purely and exclusively on what I've been posting here) do the execution side of my trading.
I've attached a screenshot of the trades I got triggered this morning on my H1 account. I love this way of trading for one single reason. I do my analysis, plan the trades and whatever happens happens. I need to go through these trades and move some of my SLs to lock in some profit, I will see to it now before I leave. I can them enjoy my couple, do my outdoor activities, travel around. That helps me disconnect from the candles. 24 hours later without being in front of the screen, I can see the results. It's not always like that, but it's worth it.
My entry on EURAUD may seem like a crap level, but it's a supply level with price bouncing of WK supply, etc, etc. I just take all levels that I see. There is a brand new H1 supply area 1.4674 which could work for scaling in. The entry on AUDJPY is a bit high in the curve but that D1 resistance is a bit used up, the entry H1 demand was not that good because it was the doji speedbump we talked about yesterday. But my personal EA took the long on the brand new H1 demand area formed after that bad 1 single doji H1 speedbump candle.
I won't be available today for long, taking a plane in a couple of hours. I just wanted to thank you all for your contributions and wish you a nice day!
Alfonso
P.S. I will get organized for the week, record a couple of videos and will send an email with new live webinar's date.
Attached Image (click to enlarge)
Set and Forget supply and demand trading community
It looks like last night I was also triggered long on H1 speedbump demand on AUDUSD.
My SL was automatically moved to breakeven at 2:1 and I was kicked at breakeven on the retest. That retest was another valid entry because it was a fresh level of demand on H1 that had taken out previous highs. My EA should have taken it because it was a valid trade according to the rules. Pity!
Alfonso
Attached Image (click to enlarge)
Set and Forget supply and demand trading community
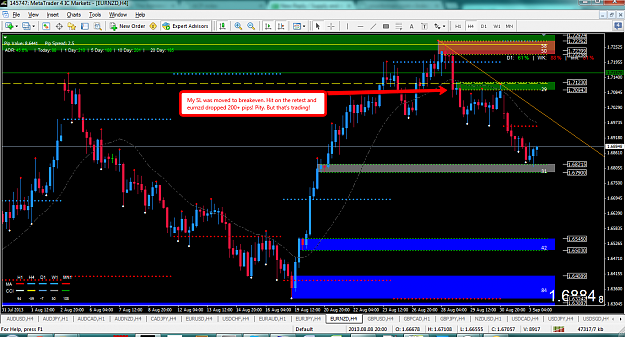
It's also a pity that my SL was moved to breakeven and hit on the restest of the EURNZD H4 supply at 1.7094. I planned and posted this trade here on the thread. It's dropped more than 200 pips. Anybody still holding that EURNZD H4 short?
Alfonso
P.S. Leaving now to the airport! Have a great day!
Attached Image (click to enlarge)
Set and Forget supply and demand trading community
It looks like last night I was also triggered long on H1 speedbump demand on AUDUSD. My SL was automatically moved to breakeven at 2:1 and I was kicked at breakeven on the retest. That retest was another valid entry because it was a fresh level of demand on H1 that had taken out previous highs. My EA should have taken it because it was a valid trade according to the rules. Pity! Alfonso {image}
Ignored
Why daily demand which you marked on AUDUSD is valid? It not taken any supply, and how your EA thinkin?
{quote} Why daily demand which you marked on AUDUSD is valid? It not taken any supply
Ignored
It was a fresh D1 demand off a monthly fresh demand! I want to trade off brand new fresh D1 demand areas at fresh original monthly demand areas. They are high probabilities! The same as fresh H1 demand areas are good at D1 demand areas. Price is fractal!
Alfonso
Set and Forget supply and demand trading community
I've been studying this thread everyday, for 15 hours, reading every post multiple times, and watching every video. Studying every picture and every post Alfonso has posted. I really thought I had finally found a logical method, that wasn't subjective, and made sense.
The more I learn about it, the more I see how illogical it is.
People just mark their own zones, when they obviously don't take out any supply/demand.
Zones that have bad departure, and bad scoring using the scoring sheet, are often successful trades, and the ones that are scored good, are often unsuccessful trades.
The logic is that robots/traders place limit orders in these zones, waiting for price to return. Ok, well the zones obviously have to be formed before the limit orders are placed. So why in the world would it matter how much trading is done in the zone, or how good the departure is? The limit orders haven't even been hit yet until price goes back to the zone, so past price action cannot be indicative of the future price action within that zone.
This scoring system is an excuse so people can use to justify the method's low win rate, instead of addressing the real issue - the inaccuracy.
And not to mention, my account is in drawdown, and I have no confidence to place another trade using this method. This 20% success rate is not enough to be profitable in the long term, and I don't want to gamble anymore money on something that is a guessing game, where the numbers are NOT on your side.
I don't want to make it seem like I am putting you down Alfonso, because I am not. I really admire how much you've put into trying to help people. I can see you are a good person, and one who is striving to help everyone become better. I hugely admire you for this, and really hope you succeed. But the fact of the matter is, this method has huge flaws, and despite how often you talk about "logic" in your eyes, this method is not logical at all. It is HIGHLY subjective, and this is why people are having such trouble replicating it. You may not have trouble, after all, you are the creator, but a subjective method is at the end of the day gambling.
I'm out of patience with this method. I've been studying this thread everyday, for 15 hours, reading every post multiple times, and watching every video. Studying every picture and every post Alfonso has posted. I really thought I had finally found a logical method, that wasn't subjective, and made sense. The more I learn about it, the more I see how illogical it is. People just mark their own zones, when they obviously don't take out any supply/demand. Zones that have bad departure, and bad scoring using the scoring sheet, are often successful...
Ignored
@ Axlz - how many trades did you open using Alfonso's method? How many wins/losses?
{quote} I see this all the time also. People just mark zones that don't consume demand/supply. Its hard to replicate this strategy, because everyone has their own levels. There is no rule for how to do them.
Ignored
The strategy is as hard to replicate as mosy strategies Axlz. You can't expect to trade successfully after 1 month or 3 months, or even 6 months. Can you achieve that? Of course you can, but that's not how life works. Life is hard, trading is as hard.
Supply and demand rules the markets and our lives on most fields. Any trading strategy is prone to subjectivity because it's ur right brain hemisphere that pulls the trigger.
I've been trying to explain how I trade, how supply and demand works, there are other ways of trading SD levels, I am aware of a couple, but based on the same principles. It's taken me 1 year to understand it and I still have a lot to learn and fine tune, but I am very happy. I didn't expect to make it in 3 months, not even in 2 years. This is a marathon race with hurdles every 100 meters, trading is not a sprint race.
I am sure you must be fed up with all this pshycological things, but it's a fact and it's key unfortunately. Well, fortunately, because once you know where the problem is, you no longer have a problem.
I know that you have had some losses, I am sure that some winners as well. You can't expect yo understand any strategy and be successful in a few weeks, that's irrational, but it can happen. It's taken me a long time and effort to put all this together on this thread, it's always the same thing over and over. Demand levels need to absorb previous supply in order to become demand, but if that demand is sitting on an even highr timeframe, it needs not to do it. I have been showing many examples like that on H1 and D1. I never wait for H1 supply levels to be absorb if price has hit fresh and original d1 demand. If d1 demand is not fresh then I will. Same applies to D1 demand at fresh and original monthly demand. It's the same over and over, and there are dozens of examples in the thread.
Ask Sekbor6 (Sebastian) about it, he's been trading sd a bit longer than you, he's doing just that.
If you feel you can't replicate it and you are discouraged, don't trade this strategy. It's that simple. Switch to another one, but I am quite sure that it will probably happen again, it's trading nature. It's all about patience and being aware that it takes months tounderstand things correctly, it does not matter how hard you study. Emotions can't be learnt, time can relax ur emotions, nothing else.
Anyway! It looks like you are an experiences trader, you know what you have to do.
My best wishes and luck to you!
Alfonso
Set and Forget supply and demand trading community
The logic is that robots/traders place limit orders in these zones, waiting for price to return. Ok, well the zones obviously have to be formed before the limit orders are placed. So why in the world would it matter how much trading is done in the zone, or how good the departure is? The limit orders haven't even been hit yet until price goes back to the zone, so past price action cannot be indicative of the future price action within that zone.
Ignored
This is not true. The orders are not placed after, the big guys don't look at the chart and say "hey there is a nice base to place orders in". The theory behind this method is to find the pockets of unfilled orders that got left behind. Yes we are all guessing to the best of our abilities that there are still orders there because these can be used up or pulled etc...
That is why short time and good departure are key as it shows that the zone could well have orders remaining unfilled. If that is the case when price come back more orders will get filled by the opposing orders that are pushing price into the zone. This is what they need is opposing orders and this is why orders get left unfilled is lack of sufficeint opposing orders. This is why Sam Seiden likes good arrival also though Alfonso does not use it is because a strong arrival means strong orders backing the move. If there are enough orders we may see a barely touch or even come a few pips short of the zone. If the orders are higher in the zone we many times will see a false break of the Distal (the issue of when is a zone removed which I am still working through) to get the higher up (or lower down) orders and to also bring in the break out traders so they have even more opposing orders to fill their orders.
I am still new to this method but I do see it's value. Is there some subjectivity into drawing the zones, yes there is. Alfonso has what seems to be set rules for drawing them that others are trying to replicate but it's up to each trader to decide, backtest and forward test how they want to draw and manage their zones. Sam has many videos on this also and his way differs from what Alfonso shows. My biggest frustration with this is more the lack of trades and this is something I am working through. I watch these bases form and most of the time price never comes back and if it does it's a long time away. This way of viewing the market structure is very eye opening or at least it has been for me.
As with anything in life no one thing fits everyone and we all need to find our place of comfort especially when it comes to the investment of our hard earned money.
I'm out of patience with this method. I've been studying this thread everyday, for 15 hours, reading every post multiple times, and watching every video. Studying every picture and every post Alfonso has posted. I really thought I had finally found a logical method, that wasn't subjective, and made sense. The more I learn about it, the more I see how illogical it is. People just mark their own zones, when they obviously don't take out any supply/demand. Zones that have bad departure, and bad scoring using the scoring sheet, are often successful...
Ignored
You don't put me down Axlz, don't worry!
I've gone through those feelings a few times in the past, I am unaffected.
Just one thing, I am not the creator of this strategy. I have not invented this way of trading. I just created a couple of indicators to make a better analysis on sd levels and added some nuances. It's all a compilation of lots of months of screentime and study, that's all.
Accuracy is not an excuse, it's a fact. But like I said, and you know probably better than me, there are hundreds of strategies. Maybe this one is not for you or I didn't manage to put the rules forward that clear.
I don't want to start a discussion on this because it would lead nowhere. I just wish u the greatest success in whatever methodology you follow!
Thanks for all your efforts!
Alfonso
Set and Forget supply and demand trading community
{quote} If there are enough orders we may see a barely touch or even come a few pips short of the zone. If the orders are higher in the zone we many times will see a false break of the Distal (the issue of when is a zone removed which I am still working through) to get the higher up (or lower down) orders and to also bring in the break out traders so they have even more opposing orders to fill their orders.
Ignored
i guess these are the ones that are called BULL and BEAR TRAPS. Just breaking the zone by few pips and then go like a rock to the way which was anticipated before.