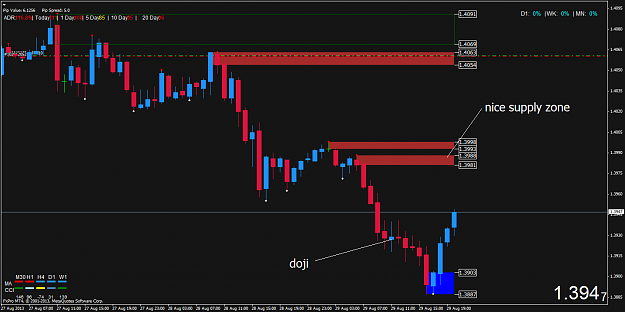
try to recall what Alfonso said about doji.
Doji is not good to use it as a speedbump.
Try to find very obvious zones. For that i use on h1 and h4 automatic Supply_Demand_zones
{quote} try to recall what Alfonso said about doji. Doji is not good to use it as a speedbump. Try to find very obvious zones. For that i use on h1 and h4 automatic Supply_Demand_zones {image}
Ignored
You're right, it's a speedbump.
really disappointed in myself. I keep making stupid mistakes. I should know better.
Can someone help me fix ADR alarm? I turned it off but all of sudden it went crazy alarming none stop.I went into library and deleted
these files to stop the alarm.
Now my ADR is not working.I fell in love with this ADR indicator and distressed that its not working anymore.
Could someone offer solution?Thank you
Attached Image
In trading, you have to be defensive and aggressive at the same time
{quote} im in that trade to but that level its not original and we must find an original level in a counter trend, i hope it works out well.
Ignored
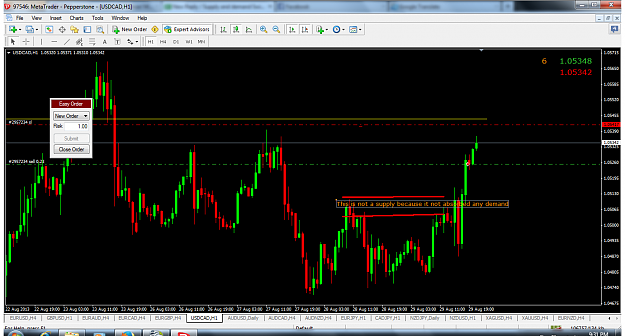
Down trend: Supply are respected and demand violated. Do you see any supply which is absorbed? No. On h1 we dont have any supply because these peaks dont absorbed any demands.
Can someone help me fix ADR alarm? I turned it off but all of sudden it went crazy alarming none stop.I went into library and deleted these files to stop the alarm. Now my ADR is not working.I fell in love with this ADR indicator and distressed that its not working anymore. Could someone offer solution?Thank you {image}
{quote} try to use those ones. Maybe it will help. PS How do you use ADR in trading? {file}
Ignored
thanks friend.Short on time running to work and I will respond ADR usage later.
I really like this one on this thread and found none better.Love to solve the alarm issue.
In trading, you have to be defensive and aggressive at the same time
{quote} Down trend: Supply are respected and demand violated. Do you see any supply which is absorbed? No. On h1 we dont have any supply because these peaks dont absorbed any demands. {image}
Ignored
Boby,
Thanks for the clarification, i also remember that Alfonso says that we need 2 demand or supply zones been absorbed in order to know if the trend has been changed.
anyway, this month its been very slow and i hope better set ups for the comming months.
Joined Sep 2010
|
Status: I'm not here... or am I?
|4,000 Posts
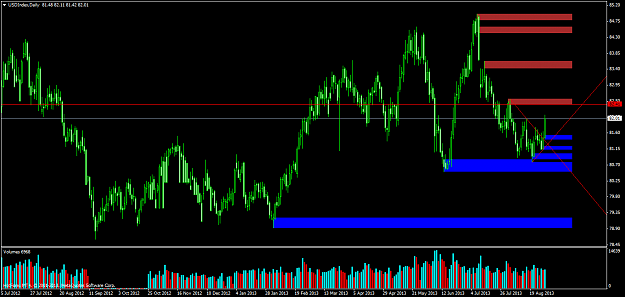
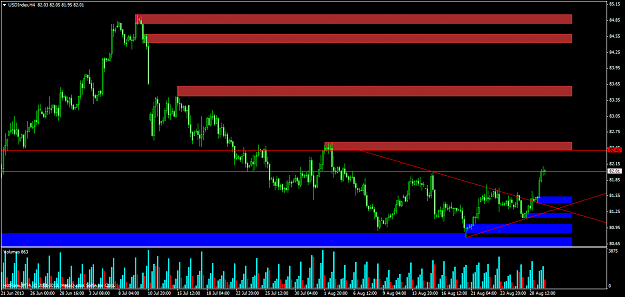
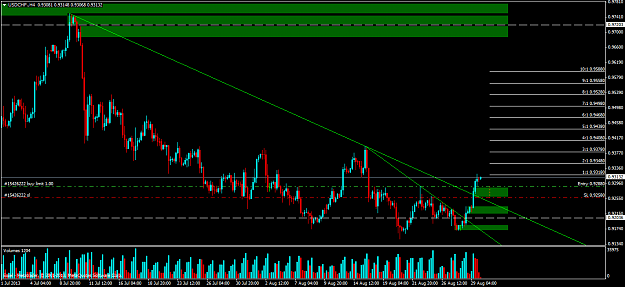
Big day today on the USD Index taking out a trendline and engulfing several old supply zones on the way up. Looks like we should be heading up to at least the first red zone shown on my chart. This is not "fresh" per say as this zone was on reaction to a previous supply zone but this was a key new zone none the less that lead to the break of the July low and demand. The move up since breaking the trendline has IMHO taken out any real supply between it and that red zone. As I am sure you all know we have recently bounced from a lovely DBR daily demand zone and have started to build new demand bases. Also as you can see on the Daily how the 4hr supply zones make sense within the bigger picture with that first (lowest) zone hitting right at the last major daily swing RBD level above where we are now. The next supply zone is the GAP fill and the two zone above that are within that highest seen RBD zone.
Attached Image (click to enlarge)
Attached Image (click to enlarge)
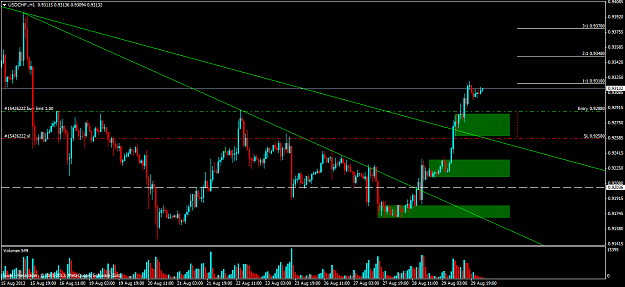
Based on all of this I am watching a 1hr zone on USDCHF for a possible long off the base that formed right after the break of the Daily trendline. Personally I like the lower two zone better because well they are lower however a return to these zones would mean that we have moved back below the trendline which would not be great however if the top zones fails I will watch these other two with interest. The lowest zone is a lovely DBR making a HL right before the recent 4hr TL was broken and the next was a RBR speedbump leading to the upper TL break. The white dashed lines are weekly S&R lines. Daily and Weekly we are coming up from not fresh but well proven support zones that appear to be holding again for now.
Attached Image (click to enlarge)
Attached Image (click to enlarge)
I am curious Alfonso how you view bases like these after a TL break. Do you still want to see the 3:1 move away? I think I have seen you tak set-ups off zones without that move away during trend changes but I may be wrong. What concerns me a bit is how many times we get great bases on the 4hr and 1hr and don't get the retraces we need based on needing that strong move away. Even Sam Seiden wants 2:1 (I think) but again I have seen him take what appear to be immediate retests off zones without the big move away. I understand if we are trading daily zone that we will many times wait weeks and months to come back but the rewards are huge. Trading 1hr and even 4hr I am curious if there are safe ways to get into more moves.
Just throwing ideas around in my head and wanted to get them down for others to comment on. I think that I may need to expand how many pairs I trade as this does give good trades but just not enough. Part of my issue working fulltime and living where I live London open is at 4AM and if I get busy at work I can miss many set-ups as they are occurring. I realize that we can't catch them all but I need to figure out how to catch more. Do I need to use all pending orders? Email alerts for dozens of levels and dozens of pairs (my wife would love that at 2AM )... There are many times that during a downtrend say we get a lovely RBD but never make it back to the base.
Alfonso I also saw that you don't trade S/R flips why is that? Also do you consider or trade ignored S/D zones are being swapped once we get a huge momentum bar that blows right through when price come back?
Quick analysis on the Dollar Index (so important for forex trading) using the new % lables displayed by the updated rectangle indicator (read previous posts). As you can see on this Weekly chart for $index. The new curve % feature is telling us that we are at only 2% of the WK demand (we can see we are bouncing off that WK demand and lots of room to rally. We also know that we are now too high on the D1 supply (96%), so buying now is not possible, we need a bigger dip to fresh demand areas OR the D1 supply taken out. On the Monthly we can see that...
Ignored
Hi Alfonso,
My charts look different to yours!
I will be grateful if you could point me to the location from where I can download your latest S&D and other indicators (especially the demand %) and templates.
Further, I am trying your spreadsheet of open office that lets us know where we are on the curve. Do you have the latest version? The one I am using has quite a few blank lines for some currency pairs! Error may be?
{quote} Hi Alfonso, My charts look different to yours! I will be grateful if you could point me to the location from where I can download your latest S&D and other indicators (especially the demand %) and templates. Further, I am trying your spreadsheet of open office that lets us know where we are on the curve. Do you have the latest version? The one I am using has quite a few blank lines for some currency pairs! Error may be? Look forward to your guidance mate. Regards. Sachu
{quote} You're right, it's a speedbump. really disappointed in myself. I keep making stupid mistakes. I should know better.
Ignored
My recommendations Axlz are two:
Try to always buy low in the curve, sell high in the curve for higher probabilities. Don't try to sell when price has dropped a lot on the entry timeframe, because price does not move in straight lines. The further it drops, the bigger the pullback, so trying to catch speedbumps when price has dropped that much it's very low probability
The lower the timeframe, the more levels you will have and the more "noise". Instead of focusing on H1 for your entries, focus on H4 for now so that you can become more patient, I believe that patience is making you take short trades that are too low in the curve and longs too high in the curve
Those are my recommendations, it's up to you now to take action Otherwise your trading will get into a loop difficult to break!
Alfonso
Set and Forget supply and demand trading community
{quote} My recommendations Axlz are two: Try to always buy low in the curve, sell high in the curve for higher probabilities. Don't try to sell when price has dropped a lot on the entry timeframe, because price does not move in straight lines. The further it drops, the bigger the pullback, so trying to catch speedbumps when price has dropped that much it's very low probability The lower the timeframe, the more levels you will have and the more "noise". Instead of focusing on H1 for your entries, focus on H4 for now so that you can become more...
Ignored
Hello Alfonso!
Thank you for the advice.
I agree with what you say about watching H4 instead of H1.
I have begun doing just that.
Thanks again. Wish you the best today before the weekend!
Where to draw the upper zone Market made a fast, furious and steady drop this morning on the Nzd.Usd. My question is: Where to draw the upper supply level. Martin {image}
Ignored
I haven't looked at the NZDUSD yet, I just started this morning, but by the time price reaches those highs you are pointing on your timeframe's trend will have changed. Besides, price has not taken out the lows!
Alfonso
Set and Forget supply and demand trading community
{quote} I haven't looked at the NZDUSD yet, I just started this morning, but by the time price reaches those highs you are pointing on your timeframe's trend will have changed. Besides, price has not taken out the lows! Alfonso
Ignored
Alfonso,
Did your short trigger for AUDCAD at 0.942 on the 4H supply?
I remember you had a limit order there, or am I mistaken?
Also, I have taken a short on USDCAD at a supply area at 1.052. What do you think of these trades?
Anybody got triggered on the ERUNZD H4 short trade I mentioned yesterday apart from Mike? I know he got triggered earlier because he showed us, his broker had different H4 speedbumps candles. The trade was triggered on my broker, 100 pips up and at breakeven now! Hopefully it will drop like a rock, let's see.
Hope you could take this short on eurnzd as well!
Alfonso
Set and Forget supply and demand trading community