• Home
  • Forums
  • Trades
  • News
  • Calendar
  • Market
  • Brokers
  • Login
  • Join
  • User/Email: Password:
  • 12:02am
Menu
  • Forums
  • Trades
  • News
  • Calendar
  • Market
  • Brokers
  • Login
  • Join
  • 12:02am
Sister Sites
  • Metals Mine
  • Energy EXCH
  • Crypto Craft

Options

Bookmark Thread

First Page First Unread Last Page Last Post

Print Thread

Similar Threads

Supply and Demand Zones 48 replies

Price movement as a function of Supply and Demand 43 replies

Supply and demand zones and EW principles 1 reply

How Markets Work, in a Nutshell! 32 replies

Demand and Supply 1 reply

  • Commercial Content
  • /
  • Reply to Thread
  • Subscribe
  • 5,252
Attachments: Supply and demand in a nutshell by Alfonso Moreno
Exit Attachments
Tags: Supply and demand in a nutshell by Alfonso Moreno
Cancel

Supply and demand in a nutshell by Alfonso Moreno

  • Last Post
  •  
  • 1 3334Page 353637 486
  • 1 Page 35 486
  •  
  • Post #681
  • Quote
  • Jul 27, 2013 4:46pm Jul 27, 2013 4:46pm
  •  TraderinSD
  • Joined Feb 2011 | Status: Probabilities, Not Absolutes | 1,246 Posts
Quoting Nametaker
Disliked
Do you guys think its possible for a counter trend on the USD/CHF? There is fresh demand on the daily (0.92374) which is just above an original demand area on the weekly (0.91347). There is also an original and fresh demand area on the daily (which i call OG Fresh) at 0.89706 which is sitting at the bottom of that weekly demand. The demand on the weekly is being respected, so is it possible it could go long? NT
Ignored
Lets take a look??? Top down>>

Monthly: We have a 9821 Supply Level Nov 2010 that is also a S/R line going back to March 2008. Supply was hit in July and Aug 2012 and again in May of 2013. Yes we are trading of the low made in Aug 2011 but since 2006 we are in a down trend. In addition, the swing at Supply/S/R previously mentioned has not been taken out. For my money the trend is down. Side note.. Interesting how we see a Supply Level with confluence to an S/R line. Just food for thought. For the record, Supply Demand is not Support Resistance but, they can appear at the same levels many times.

Weekly : We have a strong Demand @ 8078.. The market blasted off Sept 2011. Once that was completed price has meandered at best until now. Don't get me wrong there are some tradable areas along the way but they would be in the smaller TF.. We are focusing in the weekly as to give us some directional guidance.

Question:: If you look at the basic pattern of SD >> Rise-Base-Drop or Drop-Base-Rise.. Price is always moving between Supply and Demand, in all TF's. What do we see on the weekly? What do you think would be the most logical and obvious move? We are in a dominant TF.

The Weekly Base: We have LH's within the Base and if we go back ( looking left ) to about Nov 2010 we see the beginning of LH's .. Staring w/ July 2012, May 2013, July 2013...OMG a LH this month!!! Ding, Ding, Ding, Ding ......!!!! could not resist.

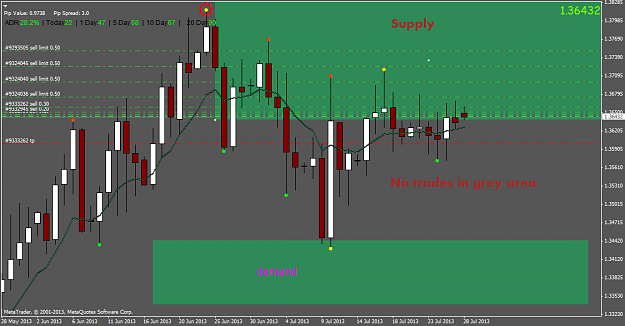
SD Range: ( A name I have given to this pattern/trade set up ) Many times the Base of the pattern ( the easiest to see ) will form a Range. We have a pretty good one here. From 9900 to 9074.. So what do we look for ..We look for our SD levels to set up @ the extremes of the Range. Why?? Confluence between Range Extremes and S/D Levels. Currently price is trading in the middle and not at the extreme. So we wait.

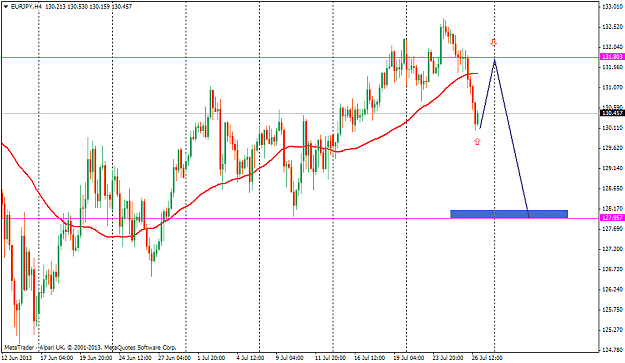
Daily: Your pick (0.92374).. I see your level but I would offer up this observation. The 9103 Demand sits closer to the "extreme" for the range than does 9237. For a counter trade I want this added insurance. So I would take the trade at the Demand of 9103. See how price did not really come down to this 9103 but fell short on Jun 13, 2013.

The 8970 which sits outside the current range bring in an interesting observation. This could also set up for a counter trend. One could argue this may be the extreme of the range. Again, we may have confluence, thus opportunity.

Lastly..If price were to fail at any of the levels there may be an opportunity to short. Big levels ( obvious blast offs of price, weekly in this case) in the larger TF tend to act like Price Magnets ( strong propensity for price to move in that direction) and we definitely have one at 8078.

As always : I appreciate Alfonso allowing me to post on his thread.. His work, ideas and videos are most excellent!!

Many pips to all

TSD
 
 
  • Post #682
  • Quote
  • Jul 27, 2013 8:40pm Jul 27, 2013 8:40pm
  •  FxPhreak
  • | Joined Mar 2008 | Status: Member | 22 Posts
Quoting sebkor6
Disliked
Hi, in attached file eur jpy (H4). I think that it will be great place to take short positions (arrow). We have fresh supply weekly level, 2 demand levels that were broken (chaniging the 4H trend). What do you think ? {image}
Ignored
Hi! I just wanted to share latest development on EURJPY as observed. Our approach is a bit different but yes we are looking at the same area. Good Luck.

**Level 131.153 may also be observed for possible turning point**
Attached Image (click to enlarge)
Click to Enlarge

Name: eurjpyh4.png
Size: 42 KB
 
 
  • Post #683
  • Quote
  • Edited 6:26am Jul 28, 2013 4:23am | Edited 6:26am
  •  panoramia
  • | Commercial Member | Joined Aug 2011 | 3,541 Posts
Hi htuanfx!

Welcome to the thread, you are most welcome!

You will see lots of examples of what we're doing to plan trades. There are quite a few videos and webinars on the thread you should watch completely, maybe more than once, to get used to this methodical way of trading, supply and demand.

I can't break the following rules, it's part of the trading plan as well as logical and common sense:

- If we are near or at a D1/WK/MN supply area, we are then too HIGH in the curve, I'm not going to BUY there
- If we are near or at a D1/WK/MN demand area, we are then too LOW in the curve, I'm not going to SELL there
- Direction timeframe is optional, you can use an intermmediate timeframe to assess direction
- You can also use trendlines on the entry timeframe to assess direction as well (more on this on the next webinars)

The next point is key in the process:

- ALL TRADES ARE PRE-PLANNED thus... I WILL ALWAYS USE LIMIT ORDERS, NEVER MARKET EXECUTION ORDERS

Hope that helps, but as I said above, you need to watch those videos on my thread, as well as reading the whole thread to understand better what we're doing here.

Alfonso

Quoting htuanfx
Disliked
Hi Alfonso, I'm really new to your system but I have try your method on MT4. There is one thing I still not clear much is about the Entry point of trade. So I will write what I understand and want you help to confirm is my knowledge is correct. That is can process via these steps: 1. Draw all SR lines of 3 timeframes (Ex: WK, D1, H4) 2. Go to WK to determine the curve High or Low (Ex: High) 3. Go to D1 to see the main trend is Low (or not), if OK then go to step 4 4. After determine the Low trend, go to H4 chart, put the Buy Limit order near the...
Ignored
Set and Forget supply and demand trading community
 
 
  • Post #684
  • Quote
  • Jul 28, 2013 6:21am Jul 28, 2013 6:21am
  •  Shabs19
  • Joined Aug 2006 | Status: Member | 4,035 Posts
I can't break the following rules, it's part of the trading plan as well as logical and common sense:

- If we are near or at a D1/WK/MN supply area, then we are too high in the curve, I'm not going to BUY there

- If we are near or at a D1/WK/MN demand area, then we are too LOW in the curve, I'm not going to SELL there


Just a little correction Alfonso, you are like me - type too fast. I always try & re-read what I just typed.
Follow the Money
 
 
  • Post #685
  • Quote
  • Jul 28, 2013 6:24am Jul 28, 2013 6:24am
  •  panoramia
  • | Commercial Member | Joined Aug 2011 | 3,541 Posts
Thanks a lot Shabs! I updated that post and it's now corrected, sorry I was copying and pasting and doing 3 things at a time and didn't re-red!
Now it's fixed, thanks for pointing it out!

Alfonso
Quoting Shabs19
Disliked
I can't break the following rules, it's part of the trading plan as well as logical and common sense: - If we are near or at a D1/WK/MN supply area, then we are too high in the curve, I'm not going to BUY there - If we are near or at a D1/WK/MN demand area, then we are too LOW in the curve, I'm not going to SELL there Just a little correction Alfonso, you are like me - type too fast. I always try & re-read what I just typed.
Ignored
Set and Forget supply and demand trading community
 
 
  • Post #686
  • Quote
  • Jul 28, 2013 7:16am Jul 28, 2013 7:16am
  •  Shabs19
  • Joined Aug 2006 | Status: Member | 4,035 Posts
I know some people said they did not have enough MT4 data to view charts in the higher timeframes, there are a couple of things that you can do to solve this.

1. You can go to Tools > Options > Charts and increase the Max bars in history and max bars in charts numbers using the drop down menu. You will have to decide the correct numbers for you, as it will slow down the start up time for MT4 with too much data.

2. Go to Tools > History Center. Then in the left column select the currency pair that you need data for by double clicking it's icon. You should get further icons that may be greyed out, by double clicking each timeframe icon in turn, you will force MT4 to retrieve missing data. ( The database will show you the details & the right handside box will become populated by candlestick data.

Attached Image (click to enlarge)
Click to Enlarge

Name: ScreenHunter_01 Jul. 28 12.18.jpg
Size: 250 KB


The above will work better when the platform is connected to Live Server, check the bottom right hand corner of platform for green bars.
Follow the Money
 
 
  • Post #687
  • Quote
  • Jul 28, 2013 7:53am Jul 28, 2013 7:53am
  •  Nametaker
  • | Commercial Member | Joined Jan 2013 | 265 Posts
Quoting TraderinSD
Disliked
{quote} Lets take a look??? Top down>> Monthly: We have a 9821 Supply Level Nov 2010 that is also a S/R line going back to March 2008. Supply was hit in July and Aug 2012 and again in May of 2013. Yes we are trading of the low made in Aug 2011 but since 2006 we are in a down trend. In addition, the swing at Supply/S/R previously mentioned has not been taken out. For my money the trend is down. Side note.. Interesting how we see a Supply Level with confluence to an S/R line. Just food for thought. For the record, Supply Demand is not Support Resistance...
Ignored
Thanks! I worded my post wrong by saying counter trend i think. I meant to say i thought it was going to go long when it hit the demand.

Could you elaborate on SD Range? Its not clicking for me.
Keep your blades sharp!
 
 
  • Post #688
  • Quote
  • Jul 28, 2013 1:22pm Jul 28, 2013 1:22pm
  •  panoramia
  • | Commercial Member | Joined Aug 2011 | 3,541 Posts
I've recorded a 1 hour video on how to correctly use the Supply and Demand spreadsheet. I've also uploaded a modified spreadsheet to the original thread's first post at http://www.forexfactory.com/showthread.php?t=424894

You will find instructions on how to install it (it requires installation of Apache Open Calc).

  1. The spreadsheet is a snapshot or bird view of higher timeframe supply and demand levels for all the instruments you are trading
  2. It helps you to assess how high or how low you are in the D1 & WK curves
  3. It helps you find confluences by comparing different instrument’s higher timeframe curves
  4. It also helps you find correlations between Commodity Dollars (Australian, New Zealand and Canadian dollars), Oil and Gold

For example:

  1. WK supply on Dollar index vs WK/D1 demand on the majors
  2. NZDUSD at or near D1 Demand vs EURNZD/GBPNZD at or near D1 Supply
  3. Gold at D1 demand vs AUDUSD at D1 demand
  4. Copper at WK demand vs AUDUSD at WK demand
  5. Oil at WK supply vs USDCAD and D1/WK demand

Trading supply and demand is all about buying low in the curve, and Selling high in the curve
Add the spreadsheet to your daily routine and it will improve your entries.

Watch the video below, you will learn full details on how to use it.

Inserted Video
Set and Forget supply and demand trading community
 
 
  • Post #689
  • Quote
  • Jul 28, 2013 3:23pm Jul 28, 2013 3:23pm
  •  Nametaker
  • | Commercial Member | Joined Jan 2013 | 265 Posts
Oh your right. I only had a quick look to see if it opened and now i see there are functions that dont work. I will delete the post.
Keep your blades sharp!
 
 
  • Post #690
  • Quote
  • Jul 28, 2013 3:40pm Jul 28, 2013 3:40pm
  •  astronaud
  • | Joined Jul 2013 | Status: Member | 22 Posts
I have one problem.Mt4 doesnt show me the pips distance in the zones.All the settings are default.
 
 
  • Post #691
  • Quote
  • Jul 28, 2013 3:50pm Jul 28, 2013 3:50pm
  •  panoramia
  • | Commercial Member | Joined Aug 2011 | 3,541 Posts
You didn't mention which indicator you're referring to We are using 2 indicators:

- Supply_demand_zones (automatic zones). This one WILL NOT show pips distance. It's not coded to do that
- Rectangle Reader (manual zones). This one will show pips distance

So I guess you are referring to the first one, so the answer is that it's not possible, so you don't have a problem
When you mention you have a problem, please describe with ALL kind of details what the problem is, indicator, chart, timeframe, etc. We can't help you if you are not specific

Alfonso

Quoting astronaud
Disliked
I have one problem.Mt4 doesnt show me the pips distance in the zones.All the settings are default.
Ignored
Set and Forget supply and demand trading community
 
 
  • Post #692
  • Quote
  • Jul 28, 2013 4:02pm Jul 28, 2013 4:02pm
  •  Tamzy1
  • | Joined Aug 2006 | Status: Member | 26 Posts
Hi, I down loaded the new Rectangular indicator, placed it in the indicator folder, it brought the normal question, do you want to replace the Rectangular indicator that already exist, i clicked yes and it replaced it. But now whenever i try to run my Metatrader, it deletes/kirks the indicator out of the indicator folder, i don't know to where. I tried to re-download it again and do the process again it keep doing the same. The sad part of it is that even the old Rectangular indicator I had on the metatrader is also now removed/deleted. Can anybody help me with this dilema?
 
 
  • Post #693
  • Quote
  • Jul 28, 2013 4:40pm Jul 28, 2013 4:40pm
  •  Davit
  • Joined Feb 2012 | Status: Member | 21,373 Posts
Quoting panoramia
Disliked
Hi htuanfx! Welcome to the thread, you are most welcome! You will see lots of examples of what we're doing to plan trades. There are quite a few videos and webinars on the thread you should watch completely, maybe more than once, to get used to this methodical way of trading, supply and demand. I can't break the following rules, it's part of the trading plan as well as logical and common sense: - If we are near or at a D1/WK/MN supply area, we are then too HIGH in the curve, I'm not going to BUY there - If we are near or at a D1/WK/MN demand area,...
Ignored

I enjoy your posts.I trade similarly and I also use 90% limit orders.
selling at lower curve or buying higher curve is less probability for profitable trade.We constantly must ask ourselves before every trade "What is my edge"
If you can't answer that convincingly then skip the trade.
In trading, you have to be defensive and aggressive at the same time
 
 
  • Post #694
  • Quote
  • Jul 28, 2013 4:50pm Jul 28, 2013 4:50pm
  •  astronaud
  • | Joined Jul 2013 | Status: Member | 22 Posts
Quoting panoramia
Disliked
You didn't mention which indicator you're referring to We are using 2 indicators: - Supply_demand_zones (automatic zones). This one WILL NOT show pips distance. It's not coded to do that - Rectangle Reader (manual zones). This one will show pips distance So I guess you are referring to the first one, so the answer is that it's not possible, so you don't have a problem When you mention you have a problem, please describe with ALL kind of details what the problem is, indicator, chart, timeframe, etc. We can't help you if you are not specific...
Ignored
I am using both indicators.I am using 1H,4H,WEEKLY and MONTHLY timeframes.In non of them i can see the pips distance .I am also using #4x Semafor alert indicator,nothing else.
 
 
  • Post #695
  • Quote
  • Jul 28, 2013 4:54pm Jul 28, 2013 4:54pm
  •  Davit
  • Joined Feb 2012 | Status: Member | 21,373 Posts
Quoting astronaud
Disliked
{quote} I am using both indicators.I am using 1H,4H,WEEKLY and MONTHLY timeframes.In non of them i can see the pips distance .I am also using #4x Semafor alert indicator,nothing else.
Ignored

try this

1.Click on default mt4 rectangle
2. Draw on the chart
3.go to custom indicators and drop Rectangle indicator on the chart

You must allow DLL on indicators
In trading, you have to be defensive and aggressive at the same time
 
 
  • Post #696
  • Quote
  • Jul 28, 2013 5:02pm Jul 28, 2013 5:02pm
  •  panoramia
  • | Commercial Member | Joined Aug 2011 | 3,541 Posts
Hi Tamzy,

This never happened to me, but I know that another member (Lou)had this problem and he had it fixed. I guess he will reply when he reads you. It has to be something related to Windows OS, permissions for the downloaded file. So wierd! It's just a file, a normal indicator, nothing special needs to be done!

Let's wait for his answer!
Alfonso

Quoting Tamzy1
Disliked
Hi, I down loaded the new Rectangular indicator, placed it in the indicator folder, it brought the normal question, do you want to replace the Rectangular indicator that already exist, i clicked yes and it replaced it. But now whenever i try to run my Metatrader, it deletes/kirks the indicator out of the indicator folder, i don't know to where. I tried to re-download it again and do the process again it keep doing the same. The sad part of it is that even the old Rectangular indicator I had on the metatrader is also now removed/deleted. Can anybody...
Ignored
Set and Forget supply and demand trading community
 
 
  • Post #697
  • Quote
  • Jul 28, 2013 5:06pm Jul 28, 2013 5:06pm
  •  panoramia
  • | Commercial Member | Joined Aug 2011 | 3,541 Posts
Thanks for your message on the thread David, I appreciate that. You made a good point there, we must ask ourselves that all the time. The problem is that our mind want to trade, it's not trained to "do nothing", it doesn't like indecision and we end up placing trades in the wrong direction, we are chasing trades. We spent 5-10 minutes analyzing a pair and we say to ourselves "I have to place a trade, long or short, but I have to do something".

The problem is that many times you are not allowed to buy or sell, you just have to patiently wait, ask yourself if you've got an edge, and act accordingly! If you can't find that edge, there are MANY other pairs where we could have it. With only a few good trades a month, we can have a nice income, so let's concentrate on the ones for which we have an edge, like Davit said!

Thanks again Davit!
Alfonso

Quoting Davit
Disliked
{quote} I enjoy your posts.I trade similarly and I also use 90% limit orders. selling at lower curve or buying higher curve is less probability for profitable trade.We constantly must ask ourselves before every trade "What is my edge" If you can't answer that convincingly then skip the trade.
Ignored
Set and Forget supply and demand trading community
 
 
  • Post #698
  • Quote
  • Jul 28, 2013 5:42pm Jul 28, 2013 5:42pm
  •  astronaud
  • | Joined Jul 2013 | Status: Member | 22 Posts
Quoting Davit
Disliked
{quote} try this 1.Click on default mt4 rectangle 2. Draw on the chart 3.go to custom indicators and drop Rectangle indicator on the chart You must allow DLL on indicators
Ignored
I tried,but it doesnt work (: .I will figure it out.I wish you all a lot of pips
 
 
  • Post #699
  • Quote
  • Jul 28, 2013 6:03pm Jul 28, 2013 6:03pm
  •  Lou
  • Joined Mar 2004 | Status: Senior Member | 1,456 Posts | Online Now
Quoting panoramia
Disliked
Hi Tamzy, This never happened to me, but I know that another member (Lou)had this problem and he had it fixed. I guess he will reply when he reads you. It has to be something related to Windows OS, permissions for the downloaded file. So wierd! It's just a file, a normal indicator, nothing special needs to be done! Let's wait for his answer! Alfonso {quote}
Ignored
I have PM 'd Tamzy for more info. What is described here is somewhat different from the problem I had.
Awaiting Tamzy's PM.
 
 
  • Post #700
  • Quote
  • Edited 7:08pm Jul 28, 2013 6:48pm | Edited 7:08pm
  •  Davit
  • Joined Feb 2012 | Status: Member | 21,373 Posts
Quoting panoramia
Disliked
Thanks for your message on the thread David, I appreciate that. You made a good point there, we must ask ourselves that all the time. The problem is that our mind want to trade, it's not trained to "do nothing", it doesn't like indecision and we end up placing trades in the wrong direction, we are chasing trades. We spent 5-10 minutes analyzing a pair and we say to ourselves "I have to place a trade, long or short, but I have to do something". The problem is that many times you are not allowed to buy or sell, you just have to patiently wait,...
Ignored

I'll share what is going on my trading
6xshorts on EC with another 4 limits waiting.This is in conjunction Canadian dollar getting stronger and possible weakening of Euro since its "due" for a retrace.
love to see it go 37 or 3750 to short with more momentum.As you can see from the chart EC is in range.
I trade with multiple entries even when I am in red I stay on the trade as long as fundamental reasons of entering the trade is still valid.
My philosophy is if you can make 300-500 pips from 1pair with multiple entries with 1 solid set up then its lot more effective then trading 10 other pairs.Mistake lot of traders do is being all over the place.
Regards

Please be advised that you trade at your own risk.I just posted my live trades.I could be wrong.
Attached Image (click to enlarge)
Click to Enlarge

Name: eurcad.daily.png
Size: 47 KB
In trading, you have to be defensive and aggressive at the same time
 
 
  • Commercial Content
  • /
  • Supply and demand in a nutshell by Alfonso Moreno
  • Reply to Thread
    • 1 3334Page 353637 486
    • 1 Page 35 486
0 traders viewing now
  • More
Top of Page
  • Facebook
  • Twitter
About FF
  • Mission
  • Products
  • User Guide
  • Media Kit
  • Blog
  • Contact
FF Products
  • Forums
  • Trades
  • Calendar
  • News
  • Market
  • Brokers
  • Trade Explorer
FF Website
  • Homepage
  • Search
  • Members
  • Report a Bug
Follow FF
  • Facebook
  • Twitter

FF Sister Sites:

  • Metals Mine
  • Energy EXCH
  • Crypto Craft

Forex Factory® is a brand of Fair Economy, Inc.

Terms of Service / ©2023