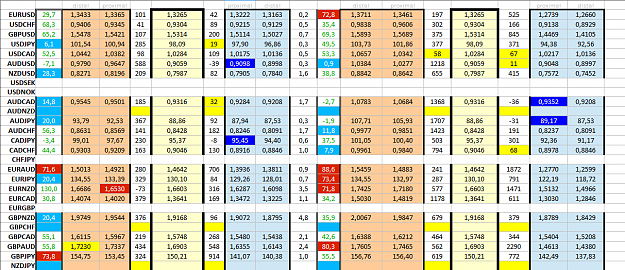
Disliked{quote} Hi Alfonso, I have been using your spreadsheet, and it works really well with accessing the curve, however i came across one of your levels in the spreadsheet and was confused about a demand level? On the GBP/USD D1 Demand level on your spread sheet you have the Prox(1.4948) Distal (1.4813). This is definitely a Demand level; however, The most recent D1 Demand level which is fresh and original is at (1.5118) Distal(1.5027). On chart below. SO my question is when using the spread sheet. should we put the most recent D1 Demand and Supply levels...Ignored
I am sure Alfonso will be getting back to you regarding your question but just so that you are aware.... if you are getting different zones this could be due to using a different broker then what Alfonso uses and your broker may have a different server time which can effect the candle formations. e.g. some brokers use 5 pm est (NY) time to end the day & some may use 12 midnight est. & still some others may use a different time. The currency price will be the same however due to the new day start time the candles may differ a little which can effect how the indicator is plotting the zones for you.
G
Find The Pain Points On Your Chart & Trade Off Those Levels
