For the chart i posted above, 300 Stoch on 15mins is equivalent to 75 stoch on the 1hr TF so we need to find the values for other TFs.
Ignored
In my view, you find your base timeframe, which is the one you will be trading from, and multiply or divide for the other TF. So if you are using 300 on M15, H1 on is 75, H4 is 18.75.....uh oh, do you think that maybe we need to find a number that will divide without a remainder on the upper time frames? Fractals should not have a remainder.
If you are good at something, never do it for free--Joker
{quote} Thanks josh! We are definitely on the trail now.
Ignored
I am currently working on using the BBZZ to detrmine tops and bottoms....
Fact: [highlight=rgba(255, 255, 255, 0)]According to Bollinger, the bands should contain 88-89% of price action, which makes a move outside the bands significant. [/highlight]
If you go back on your charts once PRICE or 1EMA hits or closes outside BB and ZZ it will always come back in...
Many time it moves from top to bottom of the BB giving us good targets!!
What I am currently testing is entry points to confirm tops or bottom....
{quote} In my view, you find your base timeframe, which is the one you will be trading from, and multiply or divide for the other TF. So if you are using 300 on M15, H1 on is 75, H4 is 18.75.....uh oh, do you think that maybe we need to find a number that will divide without a remainder on the upper time frames? Fractals should not have a remainder.
Ignored
I'm having problem with the H4 as well. I just downloaded fmsfx .xls file let's see what that gives us.
Joined Jul 2012
|
Status: KILL ZONE TEKKERS
|596 Posts
Also here is an MTF fractal indicator to play around with, you might find something......
Fractals are a relatively new area of development in mathematics which provides us with an interesting way of looking at what appears to be random chaos and breaking it down to a well structured formula.
{quote} I am currently working on using the BBZZ to detrmine tops and bottoms.... Fact: According to Bollinger, the bands should contain 88-89% of price action, which makes a move outside the bands significant. If you go back on your charts once PRICE or 1EMA hits or closes outside BB and ZZ it will always come back in... Many time it moves from top to bottom of the BB giving us good targets!! What I am currently testing is entry points to confirm tops or bottom....
Ignored
Agreed, that is one of the reason I started reading the original thread. Somebody had an understanding of probability. I saw that Vlad had suggested that instead of targeting the actual DZ, when price does come into the bands, maybe we should only target the 24 MA. What are your thoughts about that?
If you are good at something, never do it for free--Joker
{quote} Agreed, that is one of the reason I started reading the original thread. Somebody had an understanding of probability. I saw that Vlad had suggested that instead of targeting the actual DZ, when price does come into the bands, maybe we should only target the 24 MA. What are your thoughts about that?
Ignored
This is an option but for me the entry is more important... I use other indictors that I have used for years like the average price bars which once in a trade it can help you manage your exit! Because through back testing if you exit at the 24ma it will give you a profit but if you have the top/bottom which is what I am looking for you will cut your profit short!!
{quote} Agreed, that is one of the reason I started reading the original thread. Somebody had an understanding of probability. I saw that Vlad had suggested that instead of targeting the actual DZ, when price does come into the bands, maybe we should only target the 24 MA. What are your thoughts about that?
Ignored
I agree about price coming back in to BB. Its too dangerous taking entry at what you believe is the top when price is outside the BB.
Price often continues away in that direction and stops you out.
It would be great to be able to wait for price to come back into BB and take entry there, BEFORE we get to middle band.
Have anyone tried hedging for example? Wait for price to get back inside BB and place one pending order at the top/bottom BB and one on the middle?
There is a lot to try out regarding the stoch/bb/zz method.
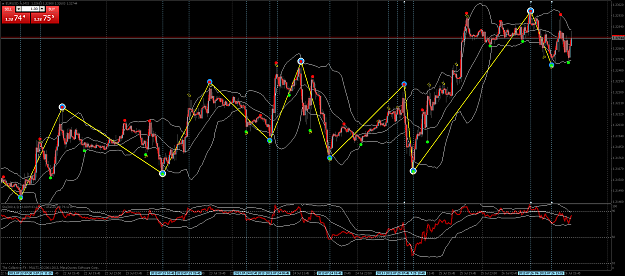
{quote} Hi JT.. sorry if i still don't understand DS Zone.. etc. I just learn and overlaying Xixi new indicator to my stoch today and still reading here and there about dis-sim. but for stoch and bb i already learn long enough for their 'maybe' correlation..lol. about my position in previous pict.., i take it at Thursday and well that just lucky guess.. i think.. tehee.... this bellow images maybe 'explain' more about 'that' position. TF : M5 {image} TF : M15 {image} TF: H1 {image} i use: standard BB (Medium Orchid) with period 18 shift 1 Deviation...
Ignored
That seemed a buy signal.
What about sell signal?
Thanks
{quote} This is an option but for me the entry is more important... I use other indictors that I have used for years like the average price bars which once in a trade it can help you manage your exit! Because through back testing if you exit at the 24ma it will give you a profit but if you have the top/bottom which is what I am looking for you will cut your profit short!! Still testing at the moment but looks very good
Ignored
I grapple with that as well. Hopefully your testing will bring some insight. In the meanwhile we are armed and at the ready! It appears there will be a good amount of forward testing going on, I am looking forward to that.
If you are good at something, never do it for free--Joker
{quote} I agree about price coming back in to BB. Its too dangerous taking entry at what you believe is the top when price is outside the BB. Price often continues away in that direction and stops you out. It would be great to be able to wait for price to come back into BB and take entry there, BEFORE we get to middle band. Have anyone tried hedging for example? Wait for price to get back inside BB and place one pending order at the top/bottom BB and one on the middle? There is a lot to try out regarding the stoch/bb/zz method.
Ignored
Yes sir, I learned that a few years back. DO NOT trade if price is outside of the bands! It could be a runaway train!
If you are good at something, never do it for free--Joker
{quote} Hi JT.. sorry if i still don't understand DS Zone.. etc. I just learn and overlaying Xixi new indicator to my stoch today and still reading here and there about dis-sim. but for stoch and bb i already learn long enough for their 'maybe' correlation..lol. about my position in previous pict.., i take it at Thursday and well that just lucky guess.. i think.. tehee.... this bellow images maybe 'explain' more about 'that' position. TF : M5 {image} TF : M15 {image} TF: H1 {image} i use: standard BB (Medium Orchid) with period 18 shift 1 Deviation...
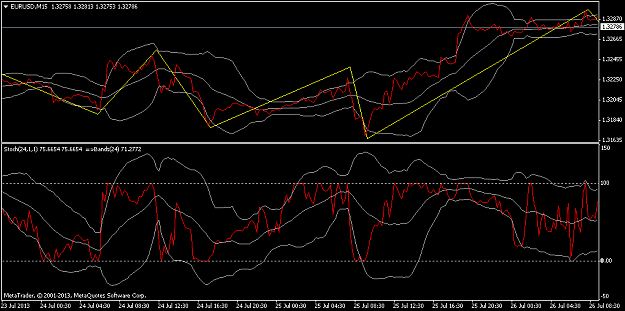
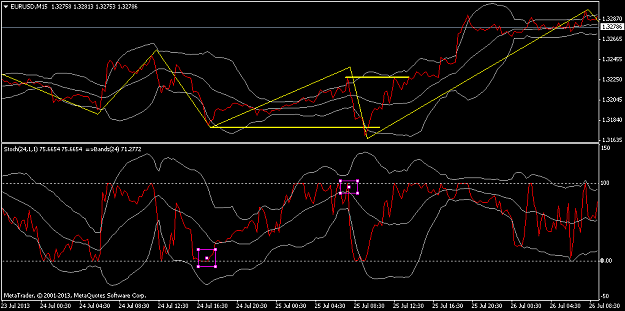
Thanks for starting this thread. Here is something I was working on before getting locked out. I have been working on 2 strategies that came from different ideas that were presented which I think show some promise:
Strategy 1
Stoch goes outside band
EMA goes outside same band
ZZ Top or Bottom forms
Enter trade
SL = 10 pips
TP is middle band
Strategy 2
Stoch goes outside band
EMA goes outside same band
ZZ Top or Bottom forms
Price crosses mid band
enter trade
SL is opposite band (top band if a short, lower band if a long)
The light blue vertical lines represent where conditions for strategy 1 were met to enter the trade. I didn't mark strategy 2, but you can see where the mid band was crossed afterwards:
Strategy 1 15 trades. 10 wins, 5 losses 119 pips
Strategy 2 11 trades, 10 wins 1 loss 195 pips
In real time live results would likely have been a little different, but both strategies have merit.
What I wanted to do next is work on an EA to test both strategies. That way different settings can be tested, optimized and then a walk forward analysis to see if this is ready for live trading. I am not the greatest programmer, so this may take a while because doing the stoch of the BB is a bitch. If someone else wants to step in that would be great.
Thanks for starting this thread. Here is something I was working on before getting locked out. I have been working on 2 strategies that came from different ideas that were presented which I think show some promise: Strategy 1 Stoch goes outside band EMA goes outside same band ZZ Top or Bottom forms Enter trade SL = 10 pips TP is middle band Strategy 2 Stoch goes outside band EMA goes outside same band ZZ Top or Bottom forms Price crosses mid band enter trade SL is opposite band (top band if a short, lower band if a long) TP is next ZZ top or bottom...
Ignored
Looking forward to you testing this in real time here next week!
If you are good at something, never do it for free--Joker
Thanks for starting this thread. Here is something I was working on before getting locked out. I have been working on 2 strategies that came from different ideas that were presented which I think show some promise: Strategy 1 Stoch goes outside band EMA goes outside same band ZZ Top or Bottom forms Enter trade SL = 10 pips TP is middle band Strategy 2 Stoch goes outside band EMA goes outside same band ZZ Top or Bottom forms Price crosses mid band enter trade SL is opposite band (top band if a short, lower band if a long) TP is next ZZ top or bottom...
Ignored
Spot on with Strategy 1 Dewey.
It is a high probability trade if the Stoch reaches the 0 or 100 level with your conditions in strat 1.