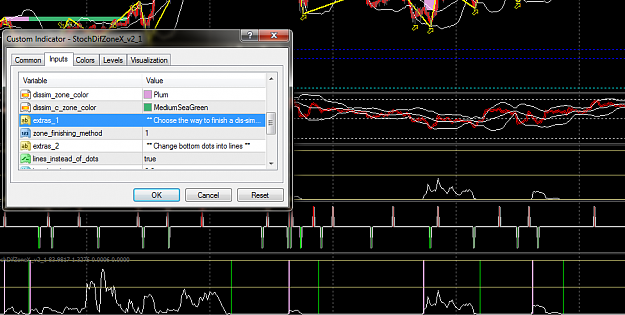
well, I see you guys are talking about the indicators, some even based on the "sim/dis-sim zones" indicator to trade but as Eurusdd said it's just about 60% correct. Do you believe on something with 60% probability of correction or something which derives from that 60%? I'm not. So what I wonder is how to find "true" sim/dis-sim zones. That takes me come back to the fundamental concept: similarity.
As Joe has just posted:
So,
What is similarity/dis-similarity? Why? When? How?
I think if we can't find the clear and correct answers for those questions first then we just based on "wrong" understanding of the principle.
So I hope to see elaboration on those questions as I read the threads many times but I think I still haven't understood those concepts at its deepest.
Thank you!
As Joe has just posted:
DislikedThanks to all who want to continue this very interesting discussion. So, what is similarity? What does it represent? What are these so called black holes? Well from what I can see, which is not very much, using indicators to spot the black holes has to do with momentum. Or better yet, uniform price flow. I think dissimilarity begins when uniform price flow ends. So price has to go back there to correct that "error" Thoughts?Ignored
What is similarity/dis-similarity? Why? When? How?
I think if we can't find the clear and correct answers for those questions first then we just based on "wrong" understanding of the principle.
So I hope to see elaboration on those questions as I read the threads many times but I think I still haven't understood those concepts at its deepest.
Thank you!