of course buddy not great stuff but too too wide..
Ignored
Ok find the person name in this thread you want to read only their posts, click on their name it will take you to their profile page then click on thread replies.
It will list their posts from most recent to earliest.
I am testing the Cycle Identifier wHistory.mq4 and it is useless not showing the disappered spike dots, repaint badly without dots, so basically same as the original indicator.
hi, I am testing the Cycle Identifier wHistory.mq4 and it is useless not showing the disappered spike dots, repaint badly without dots, so basically same as the original indicator.
Ignored
It shows the history of the major spikes not the minor spikes, there are loads of minor spikes that appear and disappear all the time, the only ones really to take a lot of notice of are the major spikes (coloured spikes)
{quote} Thank you for this!! Would you or anyone else be able to make a zigzag indicator with history as well? this would be much appreciated and probably very useful for backtesting
Ignored
Check the link in this post: http://www.forexfactory.com/showthread.php?p=6808127#post6808127
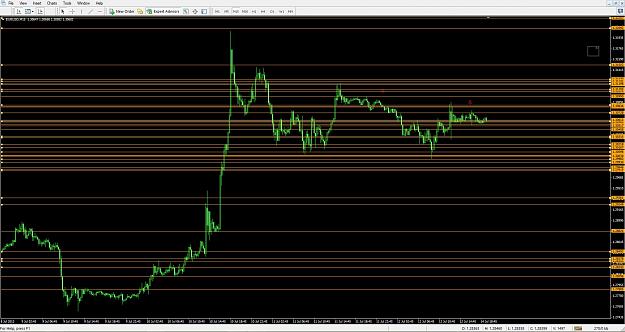
So, I start on the daily chart with the MFI and I mark the bars that are BLUE this is the Mother F@#$@$@ In charge bar, MFI,then I go to the 4 Hour chart and mark the High and Low of those bars. Those then become my KEY LEVELS. Look at how price reacts to these levels when it gets back to them I drop to lower Time frames to make my trades, now I combine the similarity principle to this analysis and I now have a money making machine. have not lost a trade yet, since I got it. The lowest TF I trade is 15 min, I do not like to scalp. {image}...
Ignored
I have a lot of spaghetti when I mark the highs and lows of the "D1 MFI bars" on H4 :nerd:
Here is a strategy that I have been using the last few years to Identify key levels to trade to and from, I spoke briefly about it in an earlier post but since we are moving in that direction at full speed I thought I might share how I do it. First, this is not to use as a trade strategy alone, I use it in conjunction with other strategies to enhance their performance. Just like the Indicator that Ralome created the levels will have differing strength and weaknesses, combining with the similarity principle gives a high direction probability. (which...
Ignored
On the standard MT4 BW MFI, the blue bars represent 'MFI up, volume down'. When you said 'spead is DOWN and volume is UP', did you mean, 'MFI down, volume up?
{quote} On the standard MT4 BW MFI, the blue bars represent 'MFI up, volume down'. When you said 'spead is DOWN and volume is UP', did you mean, 'MFI down, volume up?
{quote} I have a lot of spaghetti when I mark the highs and lows of the "D1 MFI bars" on H4 :nerd: {image}
Ignored
How many days back did you go? I only go back so far as the chart would be readable and I do not add every level if there is one within the same range. Using a daily chart no more than 60 days (60 bars)
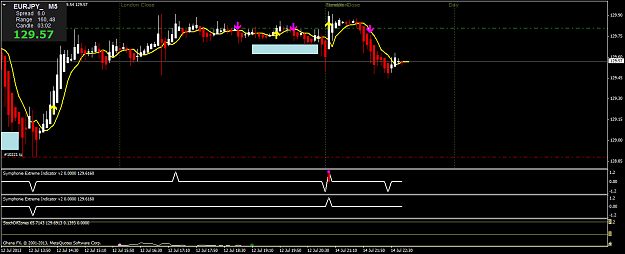
Picture below is taken from page 49. Yellow circles are marked by Madmoney, blue circles are marked by me.
I understand yellows circles' spikes have dis-similarity. But why those blue circles that I marked aren't valid entries?
Would it be correct to say that, mathematically speaking, the EMA1 is a stochastics with period infinite? Sorry if this is redundant and someone already said it. I am trying to make mathematical sense of this with my limited mathematical knowledge.
Ignored
Obviously, stochastic's scale is 0..100 while EMA1 is 0..oo. So how could it be equivalent?
But I think we could say: if period is infinite then the shape of stochastic and EMA1 is uniform which means there's no dis-similarity :nerd:
@ Madmoney or someone who knows CI. Picture below is taken from page 49. Yellow circles are marked by Madmoney, blue circles are marked by me. I understand yellows circles' spikes have dis-similarity. But why those blue circles that I marked aren't valid entries? {image}
Ignored
You can trade them too. Remember this is 1 M chart, on 5 M or 15 M you will not have all these spikes.
@ Madmoney or someone who knows CI. Picture below is taken from page 49. Yellow circles are marked by Madmoney, blue circles are marked by me. I understand yellows circles' spikes have dis-similarity. But why those blue circles that I marked aren't valid entries? {image}
Ignored
1st - great and profuse thanks to eurusdd, madmoney, ralome, etc for sharing their insights and wisdom with us - absolutely fantastic!
myichimoku, I think if you will focus on each 5M blip (bottom cycle identifier row) , Madmoney's buy/sell signals are where there is the 1st (and only 1st) missing 5M blip (dis sim) after that. He is wanting to be careful to take signals in the direction of the 5M.
"The main trend is the bottom cycle identifier, my rule is 'I will not trade against it'. I will only take DIS-SIMILARITY trades that are in the same direction of the main trend."