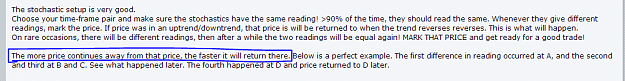
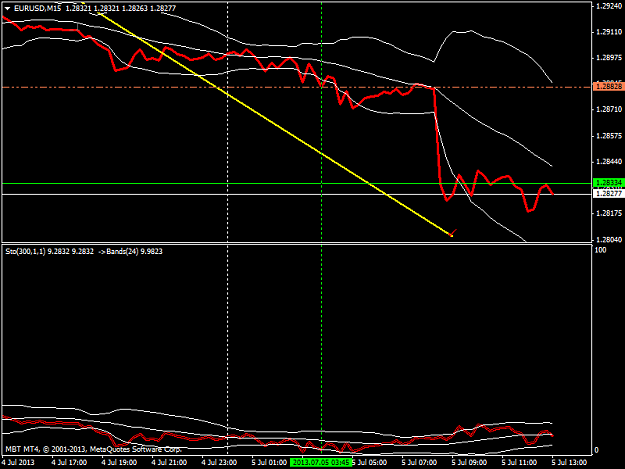
DislikedHow I traded the NFP. Across-brokers-similarity. AWESOME!!!!! SEE THAT?{image}Ignored
- #427
- Jul 5, 2013 10:27am Jul 5, 2013 10:27am
- Joined Nov 2008 | Status: Trader | 4,830 Posts
Our AWESOME IMAGINATION is the true holy grail!
- #440
- Jul 5, 2013 1:46pm Jul 5, 2013 1:46pm
- Joined Jan 2013 | Status: Trader | 1,410 Posts
Even though I walk through the darkest valley, I will fear no evil