Nice chart!!! Please note that the trick is not to trade when both cycles agree. The trick is to trade when they do not agree! When they do not agree, the trend will continue in such a way that you finally get similarity! For example, the two green arrows do not signal buy! That is a signal that the window is closing, assuming you used LENGTH as your main parameter.
help me out here, are you saying that if one of the time TF showing the signal that other TF don't have, then that is the signal i should buy/sell? thx
Joined Jul 2012
|
Status: KILL ZONE TEKKERS
|596 Posts
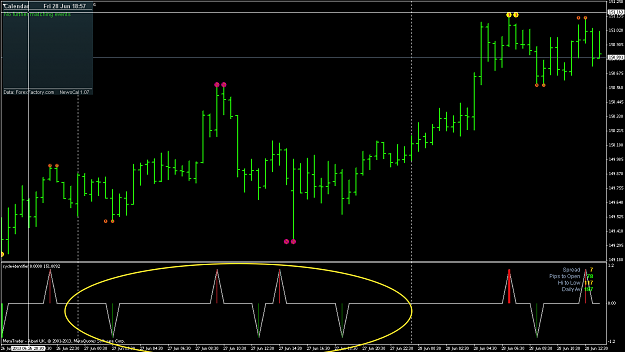
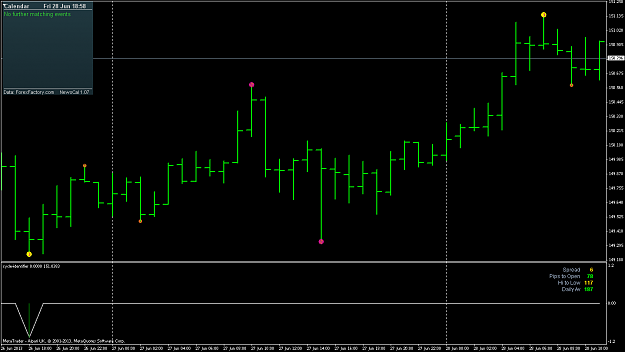
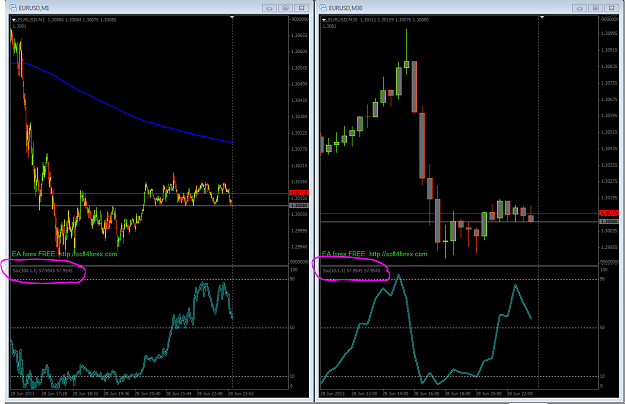
Guys it's quite simple, just take so time to break down what eurusdd explained.
If you would have traded gbpjpy yesterday like I, you would of had a field day. What is circled in yellow is the buy/sell opportunities that were available, the difference is the key!
First chart is GBPJPY 30 minute, second is GBPJPY 1hr. The settings are 1-10-4 and 1-5-4 (you might have to tweak it cause brokers differ)
Later on I'll post today's opportunities. (excuse the lateness of these posts I've got a lot on)
Guys it's quite simple, just take so time to break down what eurusdd explained. If you would have traded gbpjpy yesterday like I, you would of had a field day. What is circled in yellow is the buy/sell opportunities that were available, the difference is the key! First chart is GBPJPY 30 minute, second is GBPJPY 1hr. The settings are 1-10-4 and 1-5-4 (you might have to tweak it cause brokers differ) Later on I'll post today's opportunities. (excuse the lateness of these posts I've got a lot on) {image} {image}
Ignored
Madmoney, you are very very serious! I love your spirit! I love your chart. I hope your cycles are stable though. You have got the first trick right! When You get the remaining 3, you will have a tight system! Good!
From your settings, you are using LENGTH!!! Good, now - we will discuss how to analyze the cycles next week. Happy weekend!
|
Membership Revoked
|
Joined Oct 2012
|2,254 Posts
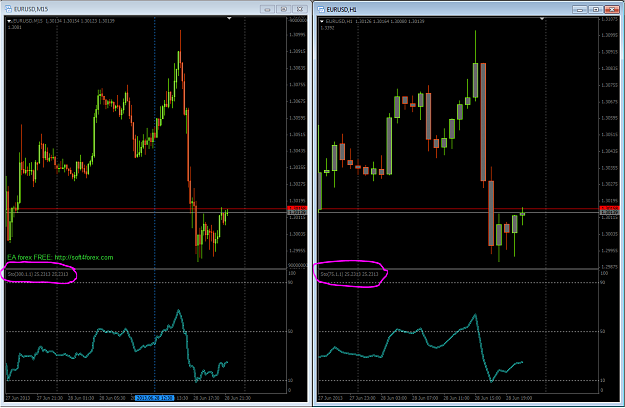
The cycle-identifier is a repainting indicator and the least used in the similarity system! The next indicator is the stochastic indicator! This one is SUPER but you need to watch your chart cause once you get the signal, you are in for a big ,,,,,,,,,,
lOOK at the two reading in the indicator window! I will explain this approach next week!
Hi Eurusdd, interesting way of trading...the Stoch looks quit the same on both charts, so we are looking for a difference too? Thanks. Regards, FL
Ignored
The stochastic setup is very good.
Choose your time-frame pair and make sure the stochastics have the same reading! >90% of the time, they should read the same. Whenever they give different readings, mark the price. If price was in an uptrend/downtrend, that price is will be returned to when the trend reverses reverses. This is what will happen.
On rare occasions, there will be different readings, then after a while the two readings will be equal again! MARK THAT PRICE and get ready for a good trade!
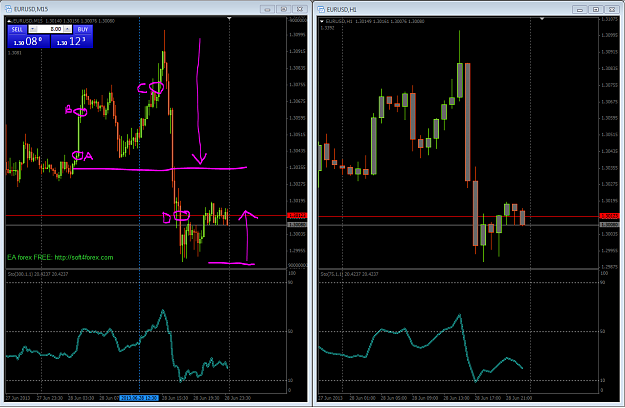
The more price continues away from that price, the faster it will return there. Below is a perfect example. The first difference in reading occurred at A, and the second and third at B and C. See what happened later. The fourth happened at D and price returned to D later.
Attached Image (click to enlarge)
Since they must AGREE more than 98% of the time, different readings at any given time means one stoch will have to catch up with the other. So, once you know the one that will have to do the catch up, you know what to do. On the other hand, different readings means, there is a turn-around and price will return to the level where the first difference was recorded! Test it yourselves!The picture below shows that you can create this for any pair of time-frames.
It is good!!!
Attached Image (click to enlarge)
Settings should be X-1-1 AND gX-1-1, WHERE gX-1-1 is for the smaller time frame. For example if you use 10min/30min then your settings will be 3x-1-1/x-1-1 where x is any positive integer.
|
Additional Username
|
Joined Mar 2012
|2,539 Posts
hmmmmm..... let's review
first we have the cycle indicator which "must" be right 90% of the time.
You can trust it when there's a difference on 2 separate time frames..
Oh... wait !! that wasn't that great but you CAN trust the stoch when
there's a difference on separate time frames
Is that about the extent of it...
or did I miss something (again) ???
When the Joker is in the deck.. fear not and play it well
hmmmmm..... let's review first we have the cycle indicator which "must" be right 90% of the time. You can trust it when there's a difference on 2 separate time frames.. Oh... wait !! that wasn't that great but you CAN trust the stoch when there's a difference on separate time frames Is that about the extent of it... or did I miss something (again) ???
sorry, but i could not see any difference on the both stochs, could you pls explain the difference on the stochs, that would be great. http://www.forexfactory.com/attachment.php?attachmentid=1223244&stc=1&thumb=1&d=1372453552 (http://www.forexfactory.com/attachment.php?attachmentid=1223244&d=1372453552)
Ignored
I think I understand it. If I'm wrong eurusdd will correct me.
You have to be looking at the actual values of the stochastics to see the difference. It's impossible to show that on an uploaded chart.
The readings you see on the blowup are for the current bars only.
{quote} The stochastic setup is very good. Choose your time-frame pair and make sure the stochastics have the same reading! >90% of the time, they should read the same. Whenever they give different readings, mark the price. If price was in an uptrend/downtrend, that price is will be returned to when the trend reverses reverses. This is what will happen. On rare occasions, there will be different readings, then after a while the two readings will be equal again! MARK THAT PRICE and get ready for a good trade! The more price continues away from that...
Ignored
Let me see if I understand this- I probably don't.
At A,B and C there is a difference in stochastics. One lags the other. Since price is heading up at those points the lagging TF will have to go up to catch up. You would buy at those points.
At D price is headed down. You would sell.
When price reverses, you would enter a trade in the direction of the reversal and exit at these points. Am I close?
{quote} Let me see if I understand this- I probably don't. At A,B and C there is a difference in stochastics. One lags the other. Since price is heading up at those points the lagging TF will have to go up to catch up. You would buy at those points. At D price is headed down. You would sell. When price reverses, you would enter a trade in the direction of the reversal and exit at these points. Am I close?
Ignored
This is my interpretation: the marked prices where the differences in stochs occur will have a "gravity" effect. So entry would be placed some distance away from these marked prices with the target of reaching back to the marked prices. ie. difference in stochs happen at price A. Price moves away from A. We take enter a position once it has move far enough to let us earn our desired pips (say 20 pips), with the target at price A. SL can be adjusted to one's risk reward appetite.
As to when and where to place the entry we can look to the cycle indicator to tell us a good price to enter, since it seems to mark a change in direction.
hmmmmm..... let's review first we have the cycle indicator which "must" be right 90% of the time. You can trust it when there's a difference on 2 separate time frames.. Oh... wait !! that wasn't that great but you CAN trust the stoch when there's a difference on separate time frames Is that about the extent of it... or did I miss something (again) ???
Ignored
You don't understand how to work with the cycle identifier - within the similarity realm!!!