I can't read code, so I have no idea what this EA does.
I've modified the code by going through it and removing the "m"s, so it matches my broker's. EA still doesn't open any trades though.
But aside from that, I am trying to understand the reasoning behind this and what has to happen before the strategy opens or closes a trade.
I am having a problem understanding your spreadsheet Insomnia.
From what I see, it goes like this
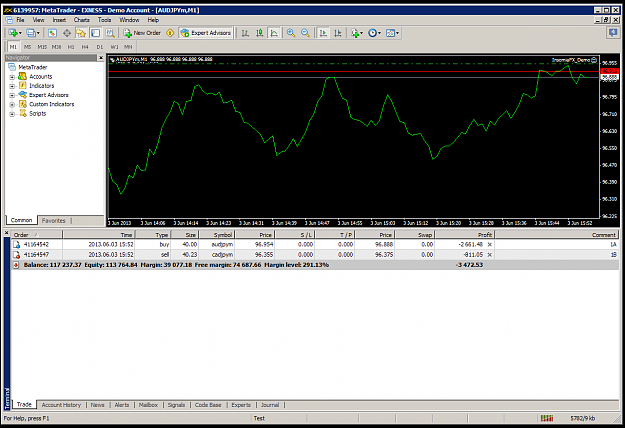
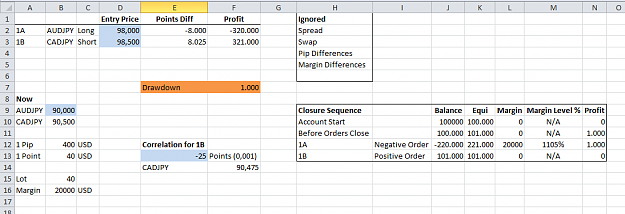
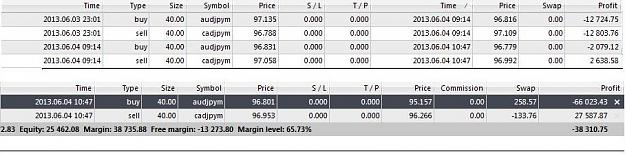
AUDJPY Long and
CADJPY Short are opened as a pair (1A and 1B)
At a later time
AUDJPY Short and
CADJPY Long are opened as a pair (2A and 2B)
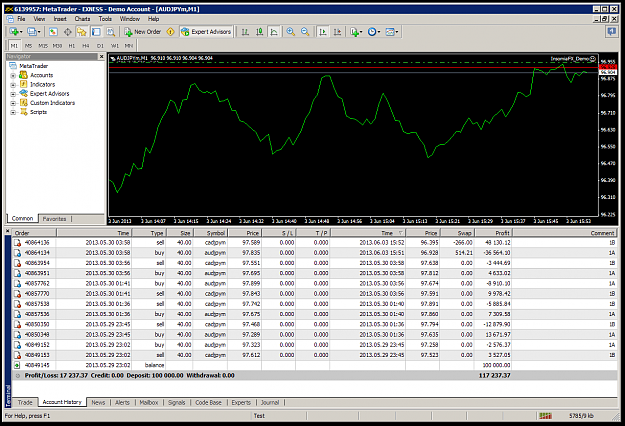
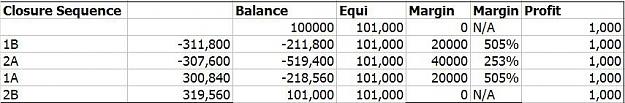
The 2 longs are closed for some reason at the same time (1A and 2B)
This leaves you with 2 open positions CADJPY short and AUDJPY short
You wait for the price to drop 50 pips then close these positions.
From your earlier posts, I understood that the AUDJPY and CADJPY were opened and closed as a pair. Same with the other 2. This does not seem to happen in your spreadsheet.
What I don't understand is where the correllation factor comes into play
If I could understand the mechanism behind this EA, I could probably do a spreadsheet to test the feasibility with past data
I've modified the code by going through it and removing the "m"s, so it matches my broker's. EA still doesn't open any trades though.
But aside from that, I am trying to understand the reasoning behind this and what has to happen before the strategy opens or closes a trade.
I am having a problem understanding your spreadsheet Insomnia.
From what I see, it goes like this
AUDJPY Long and
CADJPY Short are opened as a pair (1A and 1B)
At a later time
AUDJPY Short and
CADJPY Long are opened as a pair (2A and 2B)
The 2 longs are closed for some reason at the same time (1A and 2B)
This leaves you with 2 open positions CADJPY short and AUDJPY short
You wait for the price to drop 50 pips then close these positions.
From your earlier posts, I understood that the AUDJPY and CADJPY were opened and closed as a pair. Same with the other 2. This does not seem to happen in your spreadsheet.
What I don't understand is where the correllation factor comes into play
If I could understand the mechanism behind this EA, I could probably do a spreadsheet to test the feasibility with past data
Please Do Not PM Me With Coding Enquiries