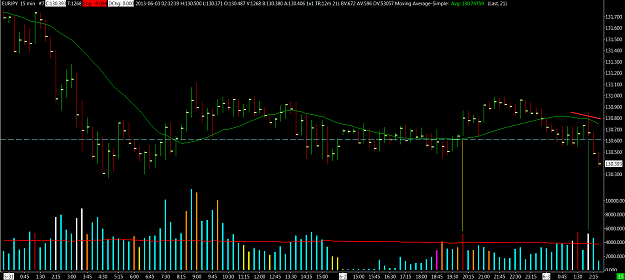
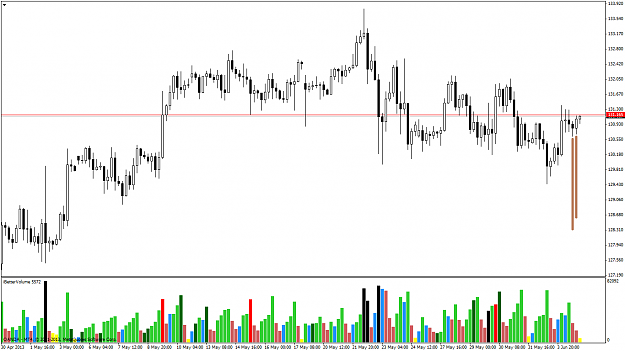
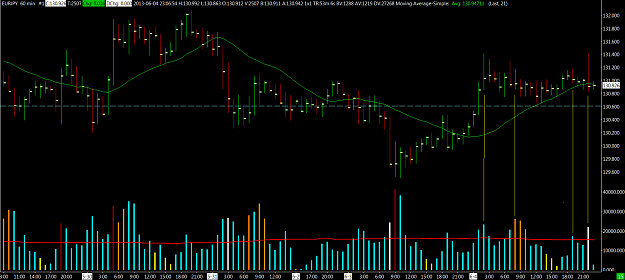
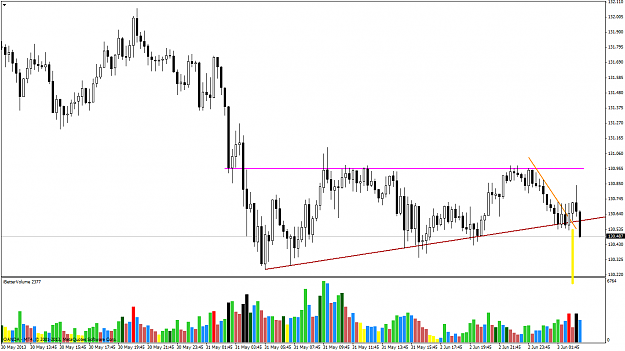
DislikedNot sure where it's going, but my bias is up at the moment. I'm seeing a few down bars with increasing volume, closing near the mid. Just waiting to see because I could be wrong{image}
Ignored
Attached Image (click to enlarge)
Yes, I do enjoy eating bananas. Very much.