It was a very good day making pips. My 1st trade EUR/USD Buy, I would have been up 40+90pips=65pip avg. However, I learned last night that you need to keep MT4 on for you Trail stops to work. Previously, I set them, and turned off my computer which in effect, did not turn them on. So instead, I b/e on this trade. In my previous charts, you may have wondered why my TS didn't hit. I think I may just rely on the multiple lots rather than Trail stops when I am away from my computer.
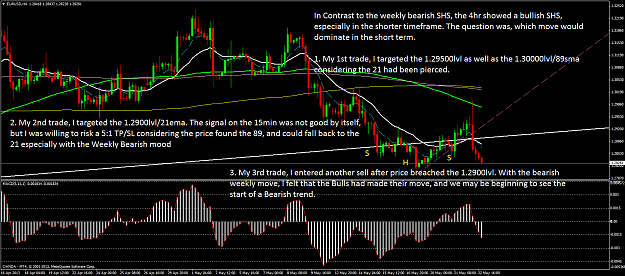
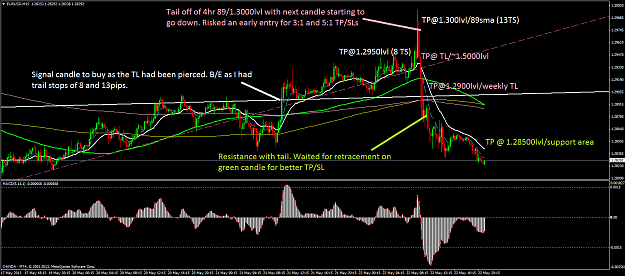
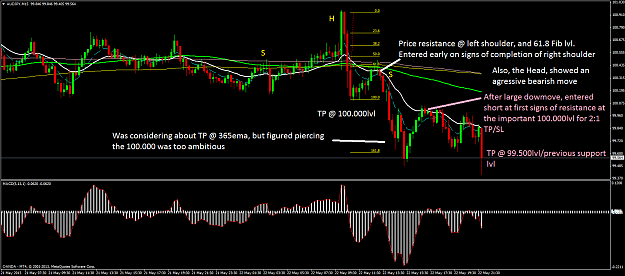
My 2nd EUR/USD Sell, I made 40+80pips,=60pipavg. I entered at first sign of resistance due to bearish mood of the weekly, especially after the bulls made their move off the SHS on the 4hr. I was willing to go early for 3:1 and 5:1 TP/SLs.
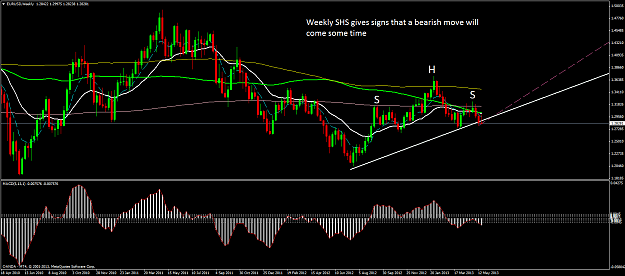
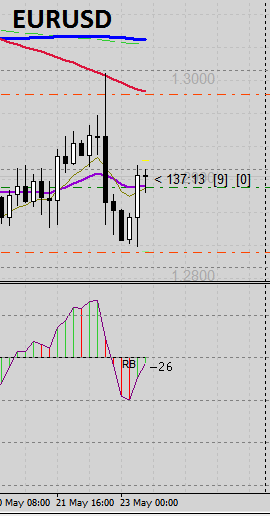
My 3rd, EUR/USD sell, happened after price broke the 1.29000lvl. I was reading the Eur/USD thead on FF, and most people were saying bullish. However, I noted the bearish SHS on the weekly. After the bullish move corresponding the the 4hr SHS, I figured that the bulls had played their part and we may be in for a bearish trend in the near future. Who knows, maybe my call was not correct, but that was just how I interpreted it.
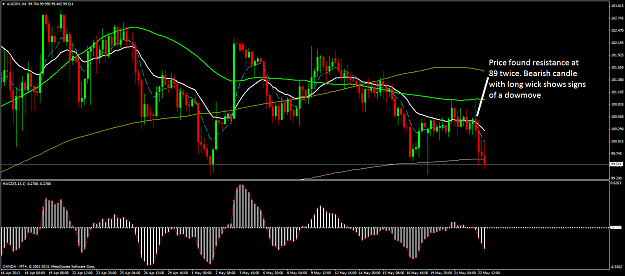
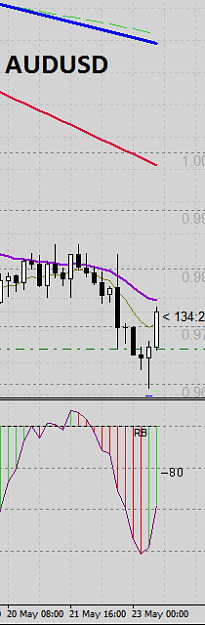
I have been demoing the AUD/JPY so I have a non-european pair to trade when I don't have signals from the EUR or JPY. Also, it gives me opportunities during the Asian session to trade. In addition, I read somewhere that it has the best pip win/lose ratio.
Here are 2 live trades on the AUD/JPY sell. 30pip on 1st and 40pip on 2nd.
Please feel free to comment, critique, or ask questions!
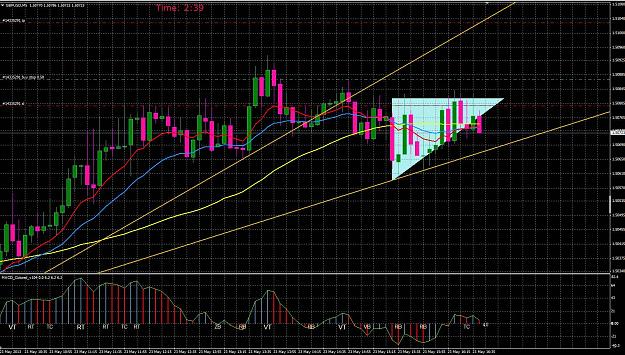
Is this how you anticipate a triangle breakout? As long as the lower tail respect the trendline, while the high is more or less the same.
And then you put in a buy stop somewhere above the average high's. The 4h macd is trending upwards too. Am I missing anything else?
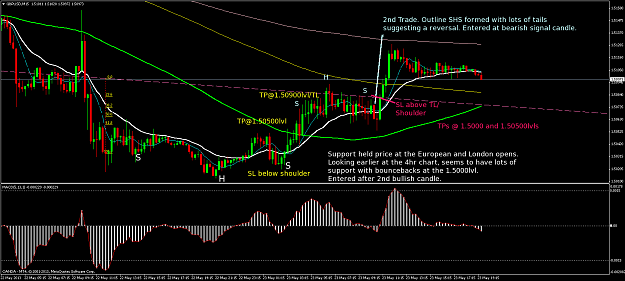
Here are 2 trades I did on the GBP/USD today. 1st: Buy profit = 15+50pips=32.5pip avg. 2nd; Sell loss = 20pips
I was anticipating a strong move down on the EUR/USD, however, during the European and London open, neither the EUR/USD or the GBP/USD fell. I noticed a SHS on the GBP/USD, which has had strong bouncebacks from the 1.5000lvl. I did not target the 21ema for a pullback as the TL was in the way, especially after a b/o yesterday. My 2nd trade, i noticed an outline of SHS on the 15min with many tails below the TL. Unfortunately it broke back into the channel.
Hope this may interest and/or help some of you,
Luke
EURUSD Daily chart: Beautiful head and shoulders, nice trend line supporting it, no divergence on the macd, could be then going up. 4 hrs chart: positive divergence on macd, tight stop below trend line. long 1.2864 SL 1.2820 for now TP 1.3010 for now {image}
Ignored
by the way, I bought on the way down, then, when the pair moved up, I took the gain.
may 23, I closed the trade with gains
what do the macd terms stand for? vt, vb, tc, rb, rt. im going through the lessons and some of the graphs have them on them but dont explain what they mean yet.
{quote}alright thanks. when i set up the indicator, the levels were 14, 29, 44. is there a reason for them being like that? i changed them to 15, 30, 45. edit: also is there a way to make it so that the levels dont reset every time mt4 is opened/closed?
Ignored
hi,
which indicator had 14, 29, 44 ?
if it reset, it did happened to me , (with others problem too)with one of platform supplier. I switched supplier with the same indicator and it works perfectly! don't ask me why, but that problem never showed up again!-and they are indicators from the tread-
that was a 4 digit supplier then they changed to 5 digits...that is when I got problems.-I still have money there, will closed the account eventually.
what do the macd terms stand for? vt, vb, tc, rb, rt. im going through the lessons and some of the graphs have them on them but dont explain what they mean yet.
Ignored
On page 1 of this tread, there is a PDF called 4 hr macd strategy, open it, go to page 8, you will read Round Top (RT)- RB(Round Bottom), read further, page 9 gives example of those abbreviations and what is expected as action from the market.
As example: on the first chart on page 9, you will see some examples and as example a RB. RB(Round Bottom) is always below the zero line, means the price is in a bearish trend but on the move to move higher, a pull back.---the RB is around october 24.
you need to get familiarize with the meaning of those terms.
{quote} On page 1 of this tread, there is a PDF called 4 hr macd strategy, open it, go to page 8, you will read Round Top (RT)- RB(Round Bottom), read further, page 9 gives example of those abbreviations and what is expected as action from the market. As example: on the first chart on page 9, you will see some examples and as example a RB. RB(Round Bottom) is always above the zero line, means the price is in a bearish trend but on the move to move lhigher, a pull back.---the RB is around october 24.you need to get familiarise with the meaning of...
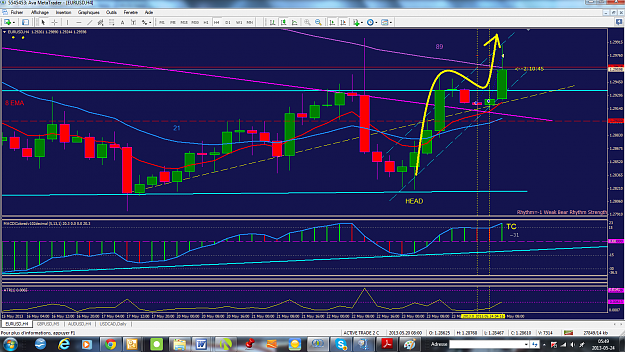
I just got back in the EURUSD long. expecting a possible break out of consolidation, get above the 89sma eventualy. entry:1.2922 targetting 1.31500 a short stop loss:1.2060
still bullish divergence in macd.
will see...
EDIT: 05:54hrs trade closed with gain
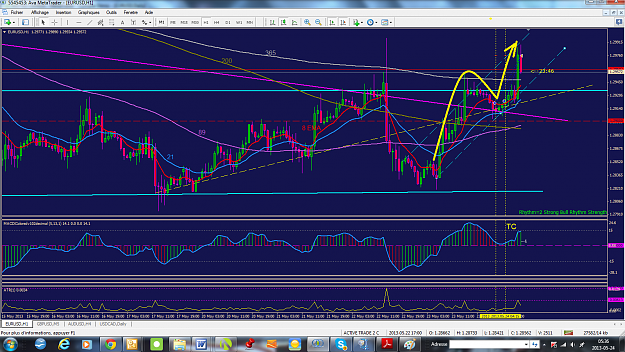
4hrs and 1hr charts:
on the 4hrs chart: price crosses the 21ema, pull back, then moved away.
on the 1 hr chart: price crosses the 89sma, pull back to 21ema, then moved away.
I just got back in the EURUSD long. expecting a possible break out of consolidation, get above the 89sma eventualy. entry:1.2922 targetting 1.31500 a short stop loss:1.2060still bullish divergence in macd.will see... EDIT: 05:54hrs trade closed with gain 4hrs and 1hr charts: on the 4hrs chart: price crosses the 21ema, pull back, then moved away.on the 1 hr chart: price crosses the 89sma, pull back to 21ema, then moved away. {image} {image}
Ignored
Nice observation Yvon,
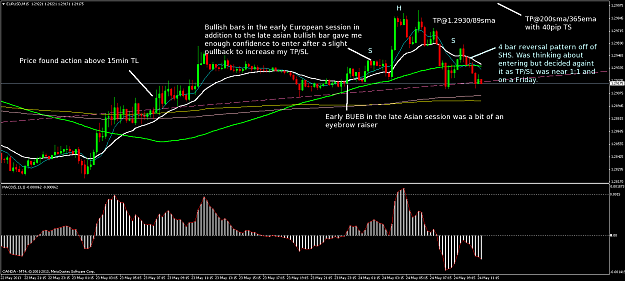
I made similar observations with yours. I did a buy in the early E-session as I saw bullish moves in the late asian session as well. Also, I wanted to go to bed early :-)
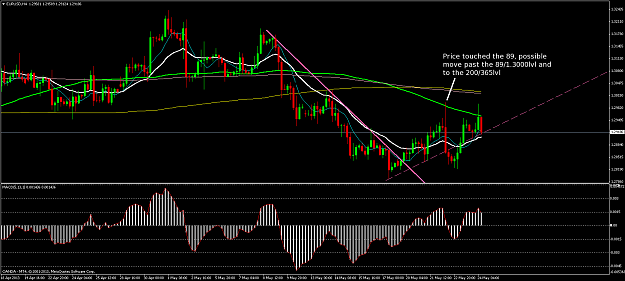
Buy EUR/USD Profit 55pip+5pip=30pip avg. Noticed previous touching of 89, so move to 200/365 was possible. TP @ 89 and 200/365 with 40pip TS. 1st target reached, 2nd TS hit.
Noticed a 2nd opportunity, however, the SHS did not seem picture perfect (at least to me), and it was on Friday and I was content with the profitable week I had. So, I decided to stop trading for this week.
Hi everyone, Is this how you anticipate a triangle breakout? As long as the lower tail respect the trendline, while the high is more or less the same.And then you put in a buy stop somewhere above the average high's. The 4h macd is trending upwards too. Am I missing anything else? {image}
Ignored
Is there anything that we can see here?- what about the triangle being within a down trend channel?
then, anticipation from a down trend would be different? what to do with the triangle?
I give my view about it.
have a nice day,
trademin you think you could discuss three sisters a little bit? im having troubling identifying them. is it just when price touches a trendline three times while in a channel?