• Home
  • Forums
  • Trades
  • News
  • Calendar
  • Market
  • Brokers
  • Login
  • Join
  • User/Email: Password:
  • 7:34pm
Menu
  • Forums
  • Trades
  • News
  • Calendar
  • Market
  • Brokers
  • Login
  • Join
  • 7:34pm
Sister Sites
  • Metals Mine
  • Energy EXCH
  • Crypto Craft

Options

Bookmark Thread

First Page First Unread Last Page Last Post

Print Thread

Similar Threads

4 Hour Strategy Macd+other Indicator 21 replies

average true range for 1 hour and 4 hour charts 2 replies

X-1102 1 hour , 4 hour and daily Tf trades 7 replies

Create a verticle line at certain hour for every certain hour 16 replies

Is the "4 Hour Strategy (MACD)" the best system here at FF? 20 replies

  • Commercial Content
  • /
  • Reply to Thread
  • Subscribe
  • 12,921
Attachments: 4 Hour Strategy (MACD)
Exit Attachments

4 Hour Strategy (MACD)

  • Last Post
  •  
  • 1 12841285Page 128612871288 1578
  • 1 Page 1286 1578
  •  
  • Post #25,701
  • Quote
  • Edited at 1:45pm May 10, 2013 10:18am | Edited at 1:45pm
  •  trademin
  • | Joined Apr 2007 | Status: Member | 910 Posts
A bit further?
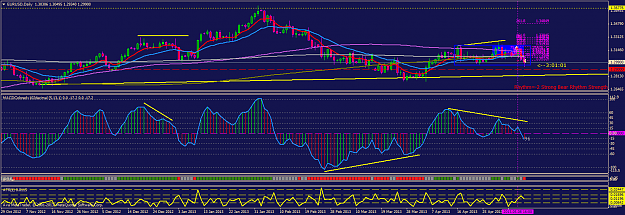
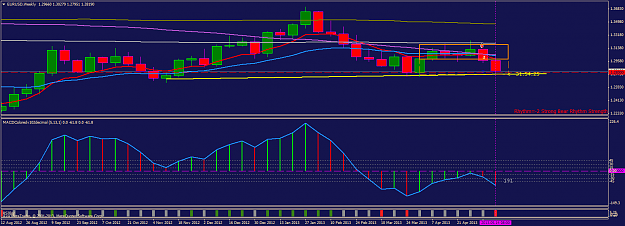
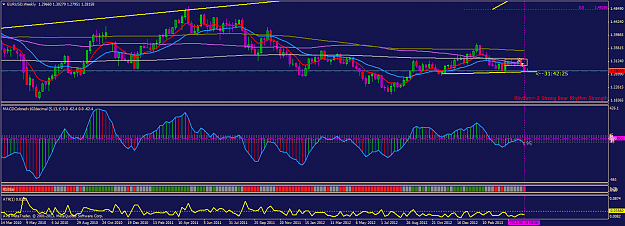
In the AUDUSD weekly (since today is the last day of the week)
if price breaks the 380 pips RANGE…than 0.9600 could be reach today…miam! miam! will see…

but before, audusd: the 200 sma if reached, then that's about 450 pips range needed (o the weekly), it is possible, that range has been hit in 2010 then 2011.

edit: price hanging around the 61.8% FIB, divergence, friday, oversold? ---closed all position with gain. will come monday.
Yvon
 
 
  • Post #25,702
  • Quote
  • Edited at 1:41pm May 10, 2013 10:33am | Edited at 1:41pm
  •  trademin
  • | Joined Apr 2007 | Status: Member | 910 Posts
just a reminder about the EURUSD:

on the daily chart: the head and shoulder still good. and there is still divergence on the macd. price still could go to 1.2800

ha! again I 'm back in! I should take a break instead, too late. in possibly for a 150 pips down or so. Will see...

doesn't move too much since at the bottom of consolidation. closed out, few pips gain.
Yvon
 
 
  • Post #25,703
  • Quote
  • May 11, 2013 12:20am May 11, 2013 12:20am
  •  TheresaH
  • | Joined Mar 2013 | Status: Member | 49 Posts
Hello everyone,

Here's a trade that I entered last night GBP/USD sell. I was anticipating a pullback to the 21, however, price broke down, so I targeted the 365 and the 200, which happens to be at the Daily TL.

Have a good weekend,
Luke
Attached Images (click to enlarge)
Click to Enlarge

Name: gbpusddaily.png
Size: 45 KB Click to Enlarge

Name: gbpusdh4.png
Size: 52 KB Click to Enlarge

Name: gbpusdm15.png
Size: 41 KB
 
 
  • Post #25,704
  • Quote
  • Edited at 11:49am May 12, 2013 11:33am | Edited at 11:49am
  •  nino110265
  • | Commercial Member | Joined Dec 2012 | 60 Posts
i dont understand

1. Level +0.0015
2. Level +0.0030
3. Level +0.0045
4. Level –0.0015
5. Level –0.0030
6. Level –0.0045


i think it only apply gbp/usd

i want use it for another paris

please explain

why use levels?
 
 
  • Post #25,705
  • Quote
  • Edited at 3:11pm May 12, 2013 12:40pm | Edited at 3:11pm
  •  trademin
  • | Joined Apr 2007 | Status: Member | 910 Posts
Quoting nino110265
Disliked
i dont understand 1. Level +0.0015 2. Level +0.0030 3. Level +0.0045 4. Level –0.0015 5. Level –0.0030 6. Level –0.0045 i think it only apply gbp/usd i want use it for another paris please explain why use levels?
Ignored
HI,
my view:
You can read back in the tread about it. That subject has been discussed. The Macd is a momentum indicator. The idea of macd is to signal overbought/oversold situations, divergence. The levels are kind of a gauge. Way back in time, +45 was very high, today we can see easily macd going above 60. In the daily chart it could go above 100, just like in the EURUSD theses days…So those levels expresses visually where the market stands.- I would think twice before buying a pair if macd is at 60 in a 4 hrs chat: as example.
have a nice day,
and I joined a pdf also that could be helpful.

You can also see post 24421 writen by Phillip Nel :-)
Attached Image (click to enlarge)
Click to Enlarge

Name: eurusd-d1-ava-financial-ltd-macd-indaily.png
Size: 58 KB
Attached File
File Type: pdf macd,,,hum.pdf   225 KB | 499 downloads
Yvon
 
 
  • Post #25,706
  • Quote
  • May 13, 2013 10:31pm May 13, 2013 10:31pm
  •  TheresaH
  • | Joined Mar 2013 | Status: Member | 49 Posts
Hello everyone,

Here is a GBP/USD buy I opened last night. Not a very strong signal candle on the 15min, but I believed r:r was ok. I set trail stops which got hit on each of my lots for a b/e (or 5 pip profit).

If you have a statement or question, feel free.

Luke
Attached Images (click to enlarge)
Click to Enlarge

Name: gbpusddaily.png
Size: 46 KB Click to Enlarge

Name: gbpusdh4.png
Size: 52 KB Click to Enlarge

Name: gbpusdm15.png
Size: 48 KB
 
 
  • Post #25,707
  • Quote
  • May 14, 2013 6:17pm May 14, 2013 6:17pm
  •  TheresaH
  • | Joined Mar 2013 | Status: Member | 49 Posts
Hello everyone,

I would like to share another trade with you all. This time a sell on the EUR/USD with 20 + 40 pips = 30pip avg. I was asleep during the initial downmove last night, but I noticed potential for a further downmove in the middle of the NY session as there was a good bounce of the 21 and 200. During this time, price consolidated into a flag with a b/o and a decent sized spinner. Profit targets to resistance areas, (if you zoom out on 4hr chart) gave good rr's with respect to the SL above the spinner on the 15min.

Q's, comments, welcome as always.

Luke
Attached Images (click to enlarge)
Click to Enlarge

Name: eurusdh4.png
Size: 50 KB Click to Enlarge

Name: eurusdm15.png
Size: 54 KB
 
 
  • Post #25,708
  • Quote
  • May 15, 2013 3:59am May 15, 2013 3:59am
  •  Acolyte
  • | Joined Dec 2012 | Status: Member | 69 Posts
Daily setups on MACD for GBPUSD and EURUSD are looking good, a few more candles for round top and we'll be ripping the move towards 21EMA or even 89SMA. There likely to be some kind of movement on AUDUSD that may decide to retrace back at least to 66fib, let's see if we can catch the wave.
Those that can't, teach, and those that can, do.
 
 
  • Post #25,709
  • Quote
  • Edited at 8:52am May 15, 2013 8:31am | Edited at 8:52am
  •  trademin
  • | Joined Apr 2007 | Status: Member | 910 Posts
Quoting TheresaH
Disliked
Hello everyone, I would like to share another trade with you all. This time a sell on the EUR/USD with 20 + 40 pips = 30pip avg. I was asleep during the initial downmove last night, but I noticed potential for a further downmove in the middle of the NY session as there was a good bounce of the 21 and 200. During this time, price consolidated into a flag with a b/o and a decent sized spinner. Profit targets to resistance areas, (if you zoom out on 4hr chart) gave good rr's with respect to the SL above the spinner on the 15min. Q's, comments, welcome...
Ignored
hi Luke,
nice shot in EURUSD, indeed the pair broke the lower support of the consolidation (around 1.3000), pulled back to what now is a resistance, did showed a negative divergence(4 hrs chart) in the macd targeting 1.2770 .the range from the consolidation should repeat itself, that is why 1.2770 could be reached.

There is a TC seen now(4 hrs chart) since the pair moved away from that new resistance to move lower. Let us not be surprised if the pair break eventually 1.2770 since there is, in the daily chart, a head and shoulder formation targeting 1.2000
nice trade,
Yvon
Yvon
 
 
  • Post #25,710
  • Quote
  • May 15, 2013 1:46pm May 15, 2013 1:46pm
  •  TheresaH
  • | Joined Mar 2013 | Status: Member | 49 Posts
Hey Yvon,

Thanks for the input. I have also noticed the head and shoulders. Though, I have not been paying that much attention to the TC, and other MACD signals lately, I will see where I can get some confirmation from them in my next trade.


Quoting trademin
Disliked
{quote} hi Luke, nice shot in EURUSD, indeed the pair broke the lower support of the consolidation (around 1.3000), pulled back to what now is a resistance, did showed a negative divergence(4 hrs chart) in the macd targeting 1.2770 .the range from the consolidation should repeat itself, that is why 1.2770 could be reached. There is a TC seen now(4 hrs chart) since the pair moved away from that new resistance to move lower. Let us not be surprised if the pair break eventually 1.2770 since there is, in the daily chart, a head and shoulder formation...
Ignored
 
 
  • Post #25,711
  • Quote
  • May 15, 2013 1:52pm May 15, 2013 1:52pm
  •  TheresaH
  • | Joined Mar 2013 | Status: Member | 49 Posts
Hey everyone,

Here's a trade I did last night: EUR/USD sell making 20pip + 70pip = 45pip avg.
I noticed that the GBP/USD had a better setup if there was to be a pullback to the 21. On the other hand, the EUR/USD has had recent heavy bearish moves, with SHS on the daily. So, I decided if there is a Bearish entry signal, I enter on the EUR. If bullish, I enter on the GBP.

Also, German news came out during the London open, so I checked the signal early to anticipate any hints before a big move was made.

My targets were at logical areas of 1.2900 and 1.28500, noting that I chose 1.28560 to be 2nd target based on previous support lvls.

Hope this may help. Please ask or make a comment if you wish.

Luke
Attached Images (click to enlarge)
Click to Enlarge

Name: eurusddaily.png
Size: 48 KB Click to Enlarge

Name: eurusdh4.png
Size: 46 KB Click to Enlarge

Name: eurusdm15.png
Size: 67 KB
 
 
  • Post #25,712
  • Quote
  • May 16, 2013 12:46pm May 16, 2013 12:46pm
  •  trademin
  • | Joined Apr 2007 | Status: Member | 910 Posts
hi,
A remember from page one of this tread about recognizing formation:

Just to show here a possible Head and Shoulder that could develop in days to come in GBPUSD. It doesn't mean it will happen, but just a possibility.
If it is the case: the neck line shows 400 pips down as projection of the HS, meaning that the 1.4900 level could be reach easily.
any comment welcome,
have a nice day,
Attached Image (click to enlarge)
Click to Enlarge

Name: gbpusd-d1-ava-financial-ltd-hs-possible2.png
Size: 49 KB
Yvon
 
 
  • Post #25,713
  • Quote
  • May 16, 2013 7:59pm May 16, 2013 7:59pm
  •  TheresaH
  • | Joined Mar 2013 | Status: Member | 49 Posts
Hey Yvon,

That's an interesting observation. Do you think it is most likely to happen? or perhaps just an interesting setup that could result in a SHS?

Cheers,
Luke


Quoting trademin
Disliked
hi, A remember from page one of this tread about recognizing formation: Just to show here a possible Head and Shoulder that could develop in days to come in GBPUSD. It doesn't mean it will happen, but just a possibility. If it is the case: the neck line shows 400 pips down as projection of the HS, meaning that the 1.4900 level could be reach easily. any comment welcome, have a nice day, {image}
Ignored
 
 
  • Post #25,714
  • Quote
  • May 16, 2013 8:04pm May 16, 2013 8:04pm
  •  TheresaH
  • | Joined Mar 2013 | Status: Member | 49 Posts
Hey everyone,

Had a 25pip loss, and then a 20pip profit on the EUR USD. For my 1st trade, (the loss), I think I may need to look for a better setup (in terms of TL's and triangles, etc) within the timeframe, rather than use a sloppy one if you get what I mean.
My second trade, I saw a SHS on the 4hr TL, so that was a clear sell to me, especially that the EUR/USD has been under pressure to move down.

If anyone has any input, especially about any critique on my loss, that would be appreciated. I'm learning everyday

Luke
Attached Images (click to enlarge)
Click to Enlarge

Name: eurusdweekly.png
Size: 33 KB Click to Enlarge

Name: eurusdh4.png
Size: 36 KB Click to Enlarge

Name: eurusdm15.png
Size: 58 KB
 
 
  • Post #25,715
  • Quote
  • May 16, 2013 11:09pm May 16, 2013 11:09pm
  •  trademin
  • | Joined Apr 2007 | Status: Member | 910 Posts
Quoting TheresaH
Disliked
Hey Yvon, That's an interesting observation. Do you think it is most likely to happen? or perhaps just an interesting setup that could result in a SHS? Cheers, Luke {quote}
Ignored
hi Luke,

Yes I think it is a possibility.
I like this word: "observation". From that word, for what it means, now by looking at what is already written in the chart, let's try to build a "Anticipation". If we can anticipate something then we could make some pips here.

By looking at the imaginary neckline on the chart ( post 25712), it is flat!
By looking at the imaginary neckline on the Macd, it is on a decline or a weakness.

Could we call it a negative divergence? I think so. - Possibly going down. Being weak, it could be oversold then the pull-back (the coming right shoulder) could reach the same level as the left shoulder, or could be stop at the yellow trend line, then going back down again.
Yes, I think so. There is a possibility that this chart at this point, could be anticipating a weak Head and Shoulders formation.
…it did happened in the past.
Yvon
 
 
  • Post #25,716
  • Quote
  • May 17, 2013 10:06am May 17, 2013 10:06am
  •  Fuiyong
  • | Joined Jan 2012 | Status: Member | 76 Posts
Is there anyway I could download this video?
Quoting yaakruay
Disliked
{quote} Did you see this video on youtube....from P.Nell about this sytem http://www.youtube.com/watch?v=ruPS0MZYCaU
Ignored
 
 
  • Post #25,717
  • Quote
  • May 17, 2013 11:17am May 17, 2013 11:17am
  •  Forex37
  • | Joined Oct 2006 | Status: Member | 544 Posts
Quoting Fuiyong
Disliked
Is there anyway I could download this video? {quote}
Ignored

Many ways: Just get one of the video download helper add ons of your preferred browser.
 
 
  • Post #25,718
  • Quote
  • Edited at 8:38pm May 17, 2013 12:13pm | Edited at 8:38pm
  •  trademin
  • | Joined Apr 2007 | Status: Member | 910 Posts
Quoting trademin
Disliked
{quote} hi Luke, Yes I think it is a possibility. I like this word: "observation". From that word, for what it means, now by looking at what is already written in the chart, let's try to build a "Anticipation". If we can anticipate something then we could make some pips here. By looking at the imaginary neckline on the chart ( post 25712), it is flat! By looking at the imaginary neckline on the Macd, it is on a decline or a weakness. Could we call it a negative divergence? I think so. - Possibly going down. Being weak, it could be oversold then...
Ignored
the Head and Shoulders taking shape. What is needed now is a break down of the neckline...Look at the macd, do you see the possibility on the right Shoulder slowly taking shape? do you see a possible weakness in is shape?
it is friday today, so I do not expect not too much move from what it is already.

look at ATR: the range done alreaday is a bit lower from the average, will it cover that range , if it is the case , we should see an extension of the range covered up to now . Otherwise, should be done next session.... that 's another 100 pips aprox.!
Attached Images (click to enlarge)
Click to Enlarge

Name: eurusd-w1-ava-financial-ltd-head-and-shoulder-mai 17.png
Size: 41 KB Click to Enlarge

Name: eurusd-w1-ava-financial-ltd-shs-2.png
Size: 55 KB
Yvon
 
 
  • Post #25,719
  • Quote
  • May 17, 2013 2:35pm May 17, 2013 2:35pm
  •  TheresaH
  • | Joined Mar 2013 | Status: Member | 49 Posts
Good observation Yvon, I have a similar view,

Last night, I was anticipating a SHS on the EUR/USD. I didn't follow my plan through to place my SL above where I thought the 2nd shoulder would form, and opted for a tighter SL. I would have made 50pips if i had followed through (i'll post later).
I am excited like you are for next session as there can potentially be many pips to be made with this setup.

Luke
 
 
  • Post #25,720
  • Quote
  • May 17, 2013 6:05pm May 17, 2013 6:05pm
  •  TheresaH
  • | Joined Mar 2013 | Status: Member | 49 Posts
Here is a sell I did on the EUR/USD. My 1st trade, I lost ~20pips as I diverted from my preset anticipated SL. Instead, I aimed for a tighter SL which of course got hit. My 2nd trade was midway through the NY session when price found resistance off the 61.8 fib level of the move down, as well as off the 15min 21. I profited around 12pips.

The signal candle in retrospect, looks quite weak. However, if anyone has any critiques, be as harsh as you want

Luke
Attached Images (click to enlarge)
Click to Enlarge

Name: eurusdweekly.png
Size: 33 KB Click to Enlarge

Name: eurusdh4.png
Size: 40 KB Click to Enlarge

Name: eurusdh1.png
Size: 41 KB Click to Enlarge

Name: eurusdm15.png
Size: 69 KB
 
 
  • Commercial Content
  • /
  • 4 Hour Strategy (MACD)
  • Reply to Thread
    • 1 12841285Page 128612871288 1578
    • 1 Page 1286 1578
1 trader viewing now
  • More
Top of Page
  • Facebook
  • Twitter
About FF
  • Mission
  • Products
  • User Guide
  • Media Kit
  • Blog
  • Contact
FF Products
  • Forums
  • Trades
  • Calendar
  • News
  • Market
  • Brokers
  • Trade Explorer
FF Website
  • Homepage
  • Search
  • Members
  • Report a Bug
Follow FF
  • Facebook
  • Twitter

FF Sister Sites:

  • Metals Mine
  • Energy EXCH
  • Crypto Craft

Forex Factory® is a brand of Fair Economy, Inc.

Terms of Service / ©2022