I saw a post and I was trying to figure out how to help traders where to put the stop loss… until I found this explanation. And as it happens to me sometime, I found an analogy to express my view. So there it is:
I remember when I was young, about 6 years old (I guess!), we used to go my friend and me, play in the little stream on my father's land. I remember that we were wearing rubber booths. Those booths that got almost to our knees!
The bottom of that stream was not all flat, sometime water went higher on the rubber booths (that was the funniest parts for both of us!) I remember that we were dragging slowly our feet trying to get the water level as high as possible, close to the edge without getting wet! That was fun!
But by looking at the depth of the water we both knew that we were able to walk in the water for a long time, we felt safe since we "kind of" averaged in our mind, the depth of the water.
To close that story, I can say that very rarely we got our foot wet! Since the eight of the rubber booths were higher that the fluctuating depth of the water! - (That we didn't know at that time!
So where to put a stop loss? You guessed it: right above what would be an "average" water level.
Each candle has its depth, by averaging them, and then just placing the Stop Loss just above that average. This way you shouldn't get your feet wet!
I'm glad that there is an indicator that does an "average" water level:
the ATR! (set at 1).
The ATR gives the water level so get your rubber (SL) height higher then that level,
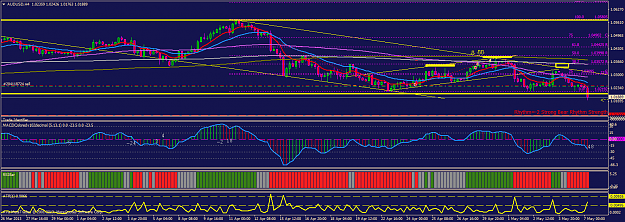
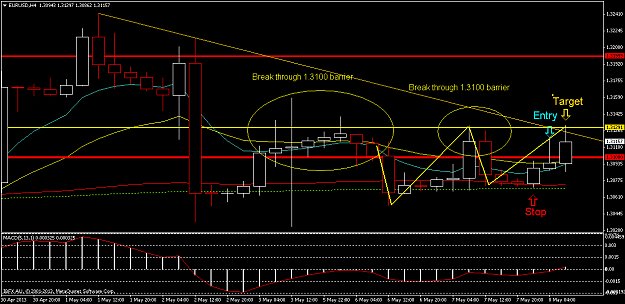
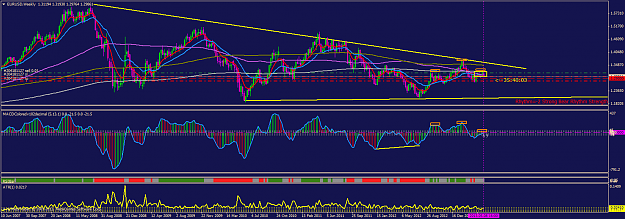
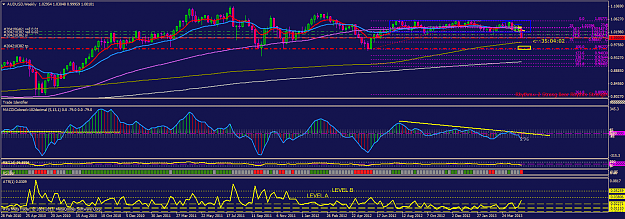
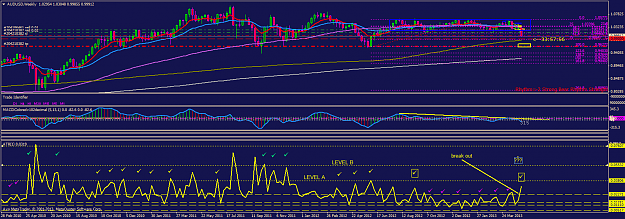
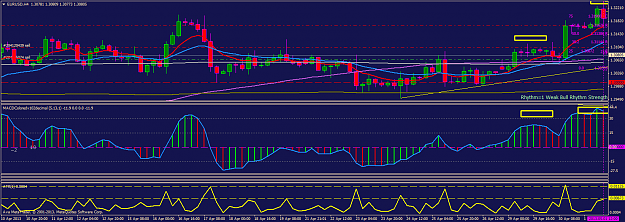
if you look at the lowest indicator on that chart you will see two levels: one with average of 67 pips or so (look at lower dotted yellow horizontal line) which is the average, while the other yellow doted line above would represent spikes level reaching about 112 pips. So one could get the rubbers booths accordingly!
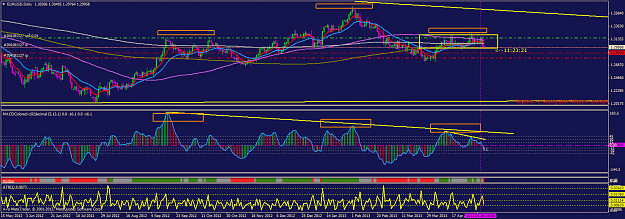
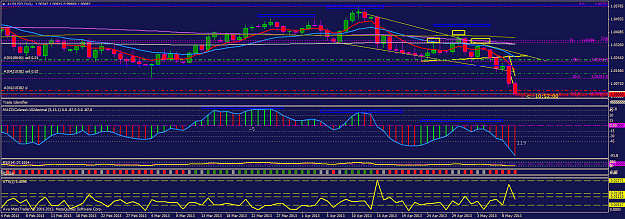
The last red candle is about 67 pips high while the macd is about 43, quite high, and then the divergence on the macd on the daily chart indicating a possible overbought situation.
So maybe at that point I would risk about 80 pips SL (from my entry)while I could think that price could reach the 21ema (in blue- about 70 pips away) since macd overbought. Lower the 89 is flat, a possible target too! (About 120 pips away) …
what I like to see is the two round top( on the macd) or maybe head and shoulders in progress!
I am not done!
…my friend and I had a lot of fun!
I remember when I was young, about 6 years old (I guess!), we used to go my friend and me, play in the little stream on my father's land. I remember that we were wearing rubber booths. Those booths that got almost to our knees!
The bottom of that stream was not all flat, sometime water went higher on the rubber booths (that was the funniest parts for both of us!) I remember that we were dragging slowly our feet trying to get the water level as high as possible, close to the edge without getting wet! That was fun!
But by looking at the depth of the water we both knew that we were able to walk in the water for a long time, we felt safe since we "kind of" averaged in our mind, the depth of the water.
To close that story, I can say that very rarely we got our foot wet! Since the eight of the rubber booths were higher that the fluctuating depth of the water! - (That we didn't know at that time!
So where to put a stop loss? You guessed it: right above what would be an "average" water level.
Each candle has its depth, by averaging them, and then just placing the Stop Loss just above that average. This way you shouldn't get your feet wet!
I'm glad that there is an indicator that does an "average" water level:
the ATR! (set at 1).
The ATR gives the water level so get your rubber (SL) height higher then that level,
if you look at the lowest indicator on that chart you will see two levels: one with average of 67 pips or so (look at lower dotted yellow horizontal line) which is the average, while the other yellow doted line above would represent spikes level reaching about 112 pips. So one could get the rubbers booths accordingly!
The last red candle is about 67 pips high while the macd is about 43, quite high, and then the divergence on the macd on the daily chart indicating a possible overbought situation.
So maybe at that point I would risk about 80 pips SL (from my entry)while I could think that price could reach the 21ema (in blue- about 70 pips away) since macd overbought. Lower the 89 is flat, a possible target too! (About 120 pips away) …
what I like to see is the two round top( on the macd) or maybe head and shoulders in progress!
I am not done!
…my friend and I had a lot of fun!
Attached Image (click to enlarge)
Yvon