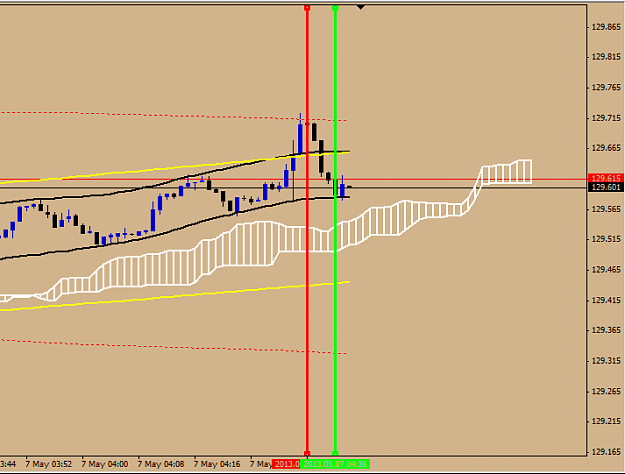
tonny, i know you are a big counter trend trader with this system, but when the H1 chart as this type of divergence this high in the bands, I would not be going long for a while. You also have a cross on the H1 TDI that is over the 68 line. Guys, save your selves tough trading by paying attention tho the H1 chart! It is the power behind this system!
Attached Image (click to enlarge)
Lord, Liar, Lunatic. Those are only 3 options to Christ's diety claim.
i agree, i sure have to pay a lot more attention to 1h. i am getting into too many trades and about breakeven for today.
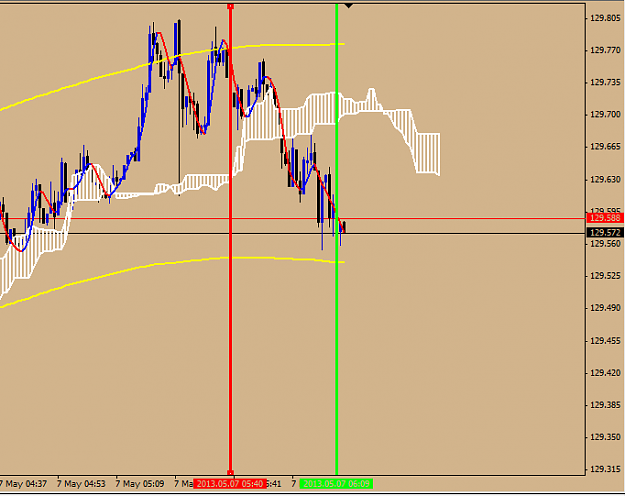
thanks for explaining the ask line - i was wondering about that too. but my main question is the actual selling or buying line. for instance as in the picture below i am in a short position marked by a green line. i cannot see it on babon templates
tonny, i know you are a big counter trend trader with this system, but when the H1 chart as this type of divergence this high in the bands, I would not be going long for a while. You also have a cross on the H1 TDI that is over the 68 line. Guys, save your selves tough trading by paying attention tho the H1 chart! It is the power behind this system! {image}
Joined Dec 2006
|
Status: Backtest is meaningless (to me)
|2,176 Posts
Hi, MR:
almost missed your post...... what i did is:
1. change a chart's timeframe to 4H
2. change 1st TMA timeframe to 240 (4H)
3. change 2nd TMA timeframe to 1440 (daily)
4. change 3rd TMA timeframe to 10080(weekly)
i changed nothing else. so in fact, i just apply favorite's template on 4H chart, since his 3 TMAs are set for M1,M5, and M15, I have to made the changes above accordingly.
but note that:
1. TMA repaints, so I have not observe to verify in realtime, TMA beyond ichimouku cloud is as effective in 4H as in M1(favorite way)
2. Favorite's timeframe factors are 1 x 5 x 3 (M1, M5, M15), and my test is 1 x 6 x 5 (H4, D1, W1). and I found that i usually have no use of the 3rd TMA on W1.
{quote} Charvo, I'd like to double check something: "...(accordingly, H1/H4 to Daily/Weekly)." - do I get it right thata) you did not change any settings in the babon (sloping line) indicator, and b) you changed the settings in the TMA indicator as follows: settings in the 1H TMA changed to daily TMA, and 4H TMA changed to weekly? Thanks.
Joined Dec 2006
|
Status: Backtest is meaningless (to me)
|2,176 Posts
another DNA?
i like your trade, excellent!
i found one by-product of this thread: the different timeframe are indeed different. a system profitable in one timeframe usually cannot be comparatively profitable on another timeframe.
tonny, the ask line color under chart set up within properties will show the line you are looking for. It does show the literal Ask line unless you check the boxs to do so. Do not do that. This will allow you to see you buy or sell line when you place the order. I would take a screen shot for you, but I am at work now. Sorry.
Lord, Liar, Lunatic. Those are only 3 options to Christ's diety claim.
i agree, i sure have to pay a lot more attention to 1h. i am getting into too many trades and about breakeven for today. thanks for explaining the ask line - i was wondering about that too. but my main question is the actual selling or buying line. for instance as in the picture below i am in a short position marked by a green line. i cannot see it on babon templates {quote} {image}
Ignored
Right Click Properties> Volumes> Change it to green
tonny, the ask line color under chart set up within properties will show the line you are looking for. It does show the literal Ask line unless you check the boxs to do so. Do not do that. This will allow you to see you buy or sell line when you place the order. I would take a screen shot for you, but I am at work now. Sorry.