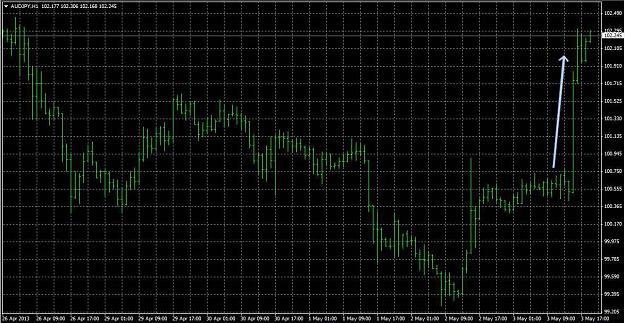
Hello, I just began my journey on VSA. I've read the first 100 pages, and below going forward, I would like to take a swing at some demo trading. Can anyone give me advice/suggestions from my interpretation of the chart? 1.) Supply Test = Low spread, closed upper half. 2.) Confirmed = Close above high of previous candle. However, it is closed somewhat in the middle, indicating that there is some selling pressure? Thank you, ieatbanana {image}
Ignored
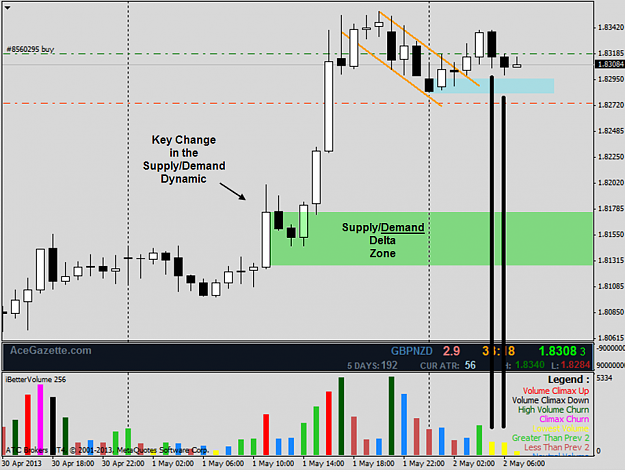
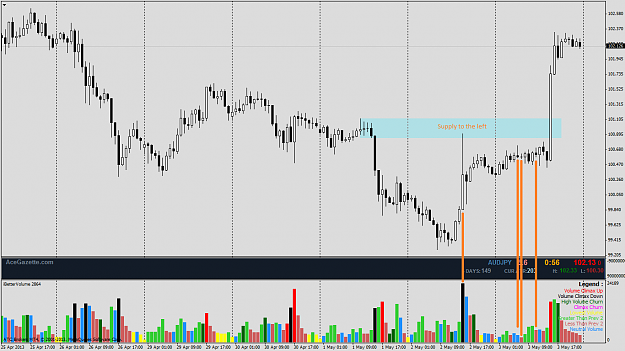
I see the words "AceGazette" on your chart. This leads me to believe you have had some exposure to Supply/Demand trading concept. My question is thus, Where is the Demand Zone form which you are taking this trade?
Sam states that one of the biggest mistakes the losing trader makes is to buy after a rise in price in a place where there is an aboundance of supply. I don't know if there is a supply zone there but I do see a rise in price. The reason to go long would have to be pretty big. Like a "zone flip", which I personally do not believe in. However, this is not the thread for that type of discussion anyway.
Although much time has passed since this post, I have not looked at a chart of this cross pair. My initial thoughts would be in line with SimpleDev. I would have been looking for a way to get short. Assuming that this weakness is appearing in a supply zone.
In fact, I see a demand zone created by the interal five intervals prior to the ultra wide spread interval on ultra high volume (bar #1). I would be looking to get long if price moved down to this level and then showed signs of strength (like a test).
*EDIT* : added chart for clarity
Attached Image (click to enlarge)
Without VSA, you're playing checkers while the Smart Money plays chess.
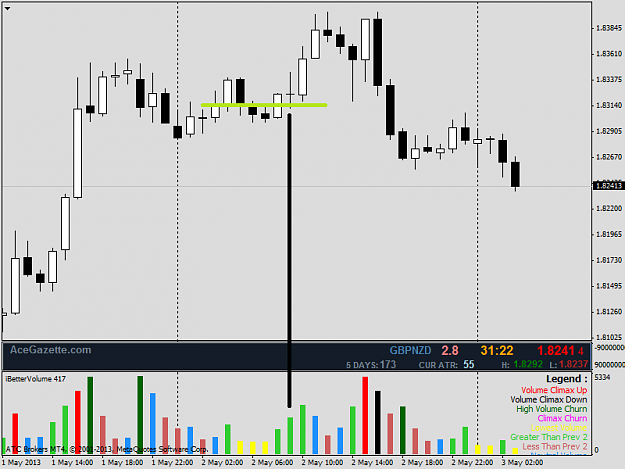
{quote} Yup I see it back on 4/1, thanks buddy I did not see that. {quote} Here is an example of how I prefer play a test after weakness appears. bar 1: Up bar high volume comes in, possible weakness. Although note the close of this bar is on the highs, which is a strong close. 2: narrow spread bar and higher volume than bar 1 and close in the middle, potential selling. 3: Hidden UT 4: SO 5: Test, you could go long here, but I think its too risky, even though bar 1 had a strong close, I am cautious of bar 2 and 3. 6&7: High volume up bars but closes...
Ignored
I closed out when the 1H bar turned into a doji, closing slightly below the middle with increasing volume. Please see chart below. If I had left the trade, it would've gotten positive. However, at that particular moment, I felt uneasy at the doji. No worries.
If I take volume out of my perspective and at a glance, I would see it as a bull flag. The bullish engulfing [demand?] at bottom of "flag" and engulfing closing above the orange line for confirmation. But I do admit that you're right. I totally ignored the bigger picture. It was a risky trade based on the background.
Engaging in conversations with all of you is so much better than lurking and reading.
{quote} I see the words "AceGazette" on your chart. This leads me to believe you have had some exposure to Supply/Demand trading concept. My question is thus, Where is the Demand Zone form which you are taking this trade? Sam states that one of the biggest mistakes the losing trader makes is to buy after a rise in price in a place where there is an aboundance of supply. I don't know if there is a supply zone there but I do see a rise in price. The reason to go long would have to be pretty big. Like a "zone flip", which I personally do not believe...
{quote} I see the words "AceGazette" on your chart. This leads me to believe you have had some exposure to Supply/Demand trading concept. My question is thus, Where is the Demand Zone form which you are taking this trade? Sam states that one of the biggest mistakes the losing trader makes is to buy after a rise in price in a place where there is an aboundance of supply. I don't know if there is a supply zone there but I do see a rise in price. The reason to go long would have to be pretty big. Like a "zone flip", which I personally do not believe...
Ignored
Excellent post! Good to hear from you again buddy.
A little bit of AJ for today, its NFP day though so LO may be a slow session.
Obviously some selling occurred today, if price rolls over I may try my hand on a short. Currently price is in an up trend (red line) so no shorts just yet.
{quote} Excellent post! Good to hear from you again buddy. A little bit of AJ for today, its NFP day though so LO may be a slow session. Obviously some selling occurred today, if price rolls over I may try my hand on a short. Currently price is in an up trend (red line) so no shorts just yet. {image}
Ignored
Uninterested selling, or cause of NFP. HMM. I'm waiting to buy on GBPNZD It's heading toward the demand area HiddenGap pointed out.
did anyone predict this move up, please share how you did it Thank you {image}
Ignored
First thing you need to do is add volume to your chart .
VSA is not about predicting. Can you attempt to make educated guesses about where price is heading using VSA? Can you venture an educated guess based on what the current PA combined with the background is tell you? Sure you can but the best practice is to trade the entries you see that align with the overall background. Do you see an entry to go long on your chart? If not perhaps it is because there was not one there or perhaps someone else can show you one you missed or overlooked. Not every move up or down has an entry and some moves just happen so quickly we cannot cash in on them so we need to be patient and choose the entries based on our trading plan and then manage the trades to suit your personal risk / MM. You can apply a little "predictive analysis" when choosing targets or when trailing your SL's based on S/D zones that are above or below your entries to determine the best places to get out or places where reversals against your trade may happen.
The best thing to do IMHO is trade what you see when you see it so long as it fits in your plan.
Nope. Too "risky" for me I would be looking to short.
Giving my analysis (forgive my inexperienced perspective):
These candle would stick out to me. Please see below. The number correspond with the orange lines drawn. 1 = 1st.
1.) Climatic Buy Bar. // Now I'll be looking for failed supply test, or demand test
2.) Upthrust bar. // Attempt to rise, but pushed down. Still waiting for test
3.) Supply test. // Lower low than the previous candles with lower volume than the previous two candles. Waiting for next candle confirmation.
The next candle thrust downward than close at the high of the supply test. There is no strong supply, or there is still strong demand present. [Waiting once more]
4.) Upthrust bar. // Attempt to rise, but pushed down once more. High of candle was near recent resistance of past 8 candles. [ Supply still present? Who knows ]
Bullish engulfing candle afterward, demand consumed supply. [Demand still strong. Back to waiting]
Nope. Too "risky" for me I would be looking to short. Giving my analysis (forgive my inexperienced perspective): These candle would stick out to me. Please see below. The number correspond with the orange lines drawn. 1 = 1st. 1.) Climatic Buy Bar. // Now I'll be looking for supply test, or failed demand test 2.) Upthrust bar. // Attempt to rise, but pushed down. Still waiting for test 3.) Supply test. // Lower low than the previous candles with lower volume than the previous two candles. Waiting for next candle confirmation. The next candle...
{quote} First thing you need to do is add volume to your chart . VSA is not about predicting. Can you attempt to make educated guesses about where price is heading using VSA? Can you venture an educated guess based on what the current PA combined with the background is tell you? Sure you can but the best practice is to trade the entries you see that align with the overall background. Do you see an entry to go long on your chart? If not perhaps it is because there was not one there or perhaps someone else can show you one you missed or...
did anyone predict this move up, please share how you did it Thank you {image}
Ignored
I posted I was bearish on this pair and was wrong, so this is just all in hindsight.
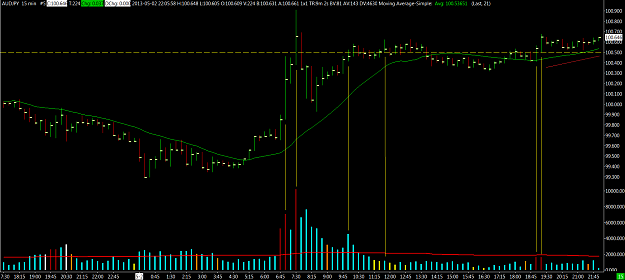
I have been looking at this move and really I didn't really see what happened until I was looking at AU. As I was looking at AU, it was more evident that the dips were being bought.
It appears that I am too short sighted when I am looking at the background. I like to read the previous day, which admittedly does work a lot of the time, but the action from Friday has shown me that there will be times when I miss what is going on in the bigger picture by only focusing on the previous day. I am starting to see that while it is beneficial to focus and determine what each session did on the prior day, it is equally beneficial to zoom out and look to see determine what the overall action did for the prior days.
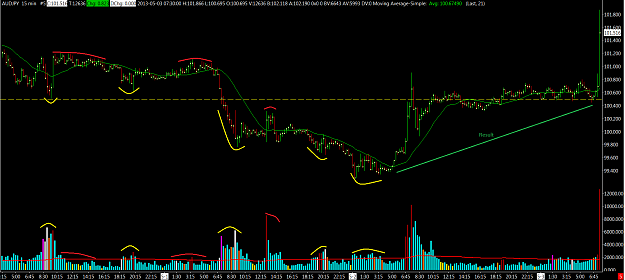
Here is AJ.
The dips (yellow) have higher volume showing us more activity was going on, while the tops (red) have very low volume, showing us that not much selling was going on. Now if you look on 5/1, there was a little bit of selling which sent the pair down even further so that it could be bought further.
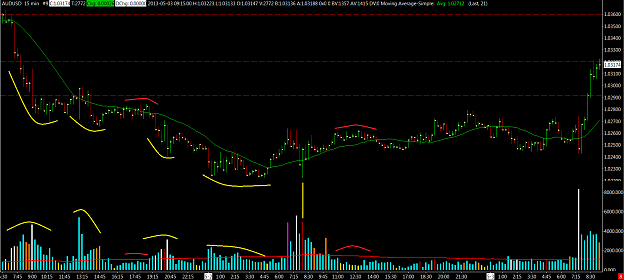
{quote} I posted I was bearish on this pair and was wrong, so this is just all in hindsight. I have been looking at this move and really I didn't really see what happened until I was looking at AU. As I was looking at AU, it was more evident that the dips were being bought.
Ignored
Here is AU, it is clearer that AJ and what made me realize that prior days are just as important as the previous day.
{quote} Right now I have only this to console myself with Thanks for the post. {quote} this was very encouraging. Hope you don't mind if I save that image of AJ (buying on dips). it is is easier to learn that way.
Ignored
I do mind, I have copy writes on my charts you must delete them immediately! I am joking, I am still learning as I go and posting helps me sort out my thoughts, and if someone else can learn something too that is great.
I think that a lot of people dismiss 4h charts because of the different brokers use different start times, I even get away from looking at them due to trying to focus on other time frames. Honestly out of my experience ( I use a 4h based on London open and one based on US open) I go to my 4h based on London open first and more often than the one based on US ( LO 7 am GMT, IBFX 4h is based on LO).
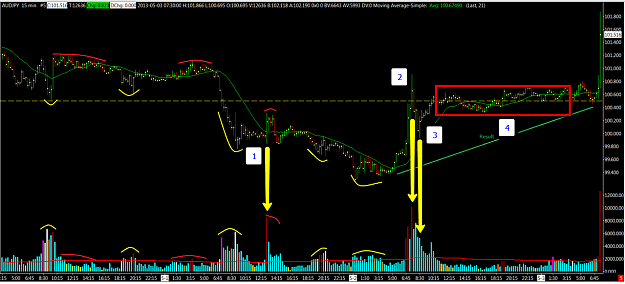
about the AJ move, I would like to add my 1cent on this one, using SD charts(infringing copy rights here! :-)
It is also in hindsight but it is highly valuable to input it in our minds for next time we see it.
Anyways, the point I would like to reinforce is that it is worth to keep high volume areas in the charts until they are clearly exhausted because it can help us to read the story in the future, like this one.
Attached Image (click to enlarge)
1. HV up bar, showing selling there(and the price fell, indeed)
2. effort to rise or effort to break the supply area in 1(here is where old HV areas come into play because it gives context to the next price/volume action)
3. this pull back is with lowering volume and much lower than the volume in the area 1. It is testing the supply that was in area 1 in the previous day
4. here the price is being hold in the HV area 2, showing that the buyers that swallowed the selling at 1 are committed to keep the price up
Again, it is in hindsight but using previous HV areas to read the actual price/volume action is a good way to get the right context.
KinsaleForex and HG are good references on how to do that. I learn with their posts.
Do not fall in the trap of "prediction". It is very dangerous because in the very moment you say "I will predict GU next move", than you lost the flexibility to go with the market wherever it wanna go.
Trading is all about flexibility, and it is better wait the market tell us where it goes.
If you are correct in your prediction, than you feel genius. But if you are wrong a couple of times, than you start to feel we cannot do this and so on.
It is easy to put stop loss orders on our trading capital but it is very hard to put stop loss orders on our psychological capital.
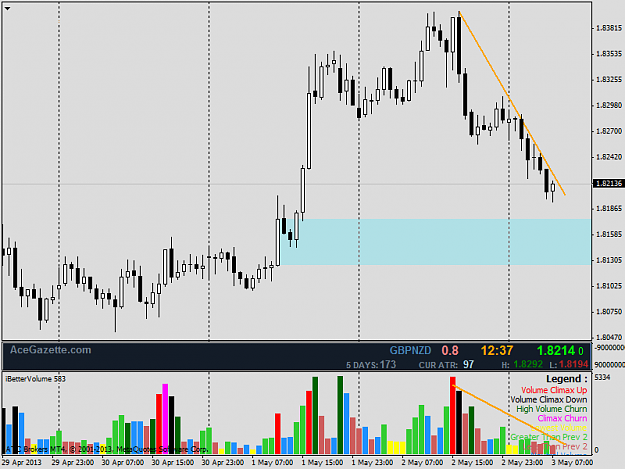
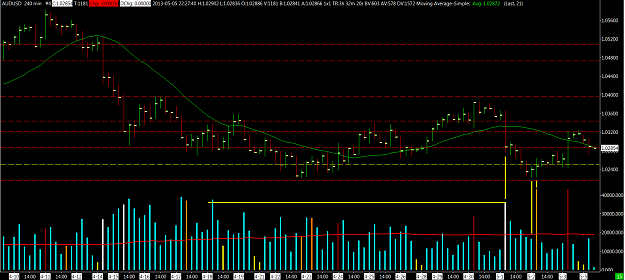
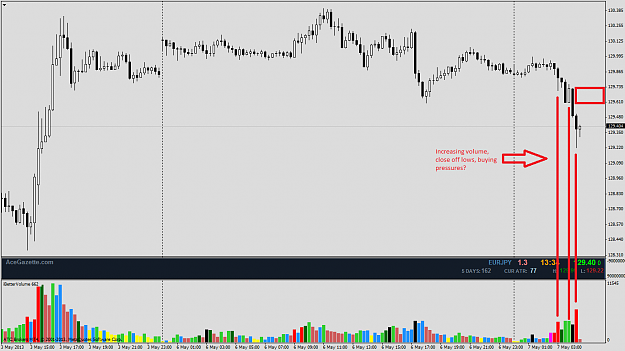
Here is a live chart that has caught my attention. Based on it's reaction, I will decide to trade or not. High supply at red box, hoping for a test of supply after it hit that box.
My bias is up, atm. Volume is increasing, as down bars close off its high.
about the AJ move, I would like to add my 1cent on this one, using SD charts(infringing copy rights here! :-) It is also in hindsight but it is highly valuable to input it in our minds for next time we see it. Anyways, the point I would like to reinforce is that it is worth to keep high volume areas in the charts until they are clearly exhausted because it can help us to read the story in the future, like this one. {image} 1. HV up bar, showing selling there(and the price fell, indeed) 2. effort to rise or effort to break the supply area in 1(here...
Ignored
Excellent post! The high of your bar 1 acted as support to the low the consolidation area you marked with the box.
Hello All, Happy Monday to you all! Here is a live chart that has caught my attention. Based on it's reaction, I will decide to trade or not. High supply at red box, hoping for a test of supply after it hit that box. My bias is up, atm. Volume is increasing, as down bars close off its high. Feel free to input, anyone. {image}
Ignored
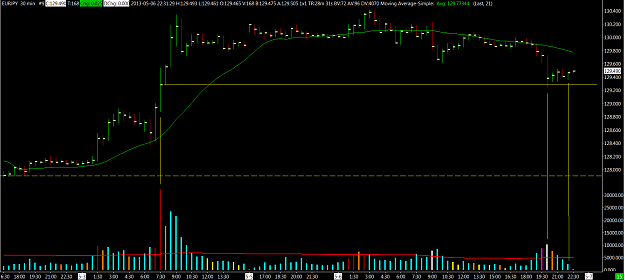
Nice catch!
30m chart, the area you showed us tested the close of the highest volume bar from Friday. EJ does look bullish.
Pivot at 129.50 and weekly fib at 129.60, these would be some good areas to look for tests.
{image}
Ignored