1. Babon system
Right now I trade with Babon only EURJPY, but the system works just fine if you trade GBPJPY, EURUSD, GBPUSD. I'm sure other pairs would do just fine too. Later, when we have a Dashboard, I'll be trading more pairs.
M1 trading contains three parts - Classic Babon, pattern "TMA M1 beyond the Ichimoku cloud" and "TMA M1 beyond TMA M5/M15", you can trade any of them individually or two of them or all three.
Babon system is a two-step operation. First we get the big picture, then we go to M1.
We have three templates. Babon-H1 is for getting big picture, Babon-A and Babon-B are for M1.
Template Babon-A is the same I uploaded in the post #930, and TMA and Babon Slope are the same I posted in post #930.
Template Babon-H1 is a new one, TDI Red Green and Heiken Ashi are the new indicators too, so you have to download all this stuff.
Template Babon-B is a little different comparing to the post #930, TMA M1 shows it's center line (dotted black line), and I got rid of the TMA H1 and TMA H4, so you'd better replace the old one by the new one.
2. When to trade and when not to trade
First of all, even before we open any charts we have to decide - is it the right time for trading? If it is not - we just don't trade, just that simple! It sounds funny, but if the trader doesn't know when he'd better stay out of the market, he's gonna lose!
There are days when the market is too "thin". We'd better stay out of the market on big holidays (New Year, Good Friday, 4th of July, Labor Day, Thanksgiving Day, Cristmas) and on bank holidays.
There are news that can screw up any trading. I don't trade Non-Farm Fridays (the whole day).
There are news that are important and we'd better watch out. I recommend to stop trading 30-60 minutes before the important news and stay out of the market for at least one hour after the news. For me the important news are: Unemployment Claims, important meetings and important press-conferences (BOJ, Draghi, Bernanke etc.). That's it! I don't think all so called "red news" are important! Only high-impact news are important! And, of course, if you trade a currency like AUDUSD, GBPUSD etc. you have to watch out for this currency's rate change, for a particular currency that would be a high-impact news too!
Time of the day is very important too! I personally usually trade from approximately 11:30 PM EST to 11:00 AM EST, I try not to open any new trades after 10:00 AM EST. I think if you trade EURJPY or GBPJPY you can start even much earlier, maybe at 7:00 PM EST. But whatever you trade I don't recommend trading between 11:00 AM EST and 7:00 PM EST. Yes, there are days when you can make very good pips trading in the afternoon, but usually after the Europe is closed and America goes to lunch the market becomes "thin", you don't want to trade at this time.
And, of course, you don't want to trade when the market is ranging! With Babon we have to goals:
a). When it is trending our goal is to make a very good amount of pips (but don't be too greedy).
b). When it is ranging our goal is not to lose (play it safe).
Now about this greed. I recommend to have two daily goals, the moderate one and the big one. For example my moderate daily goal is 50 pips and my big daily goal is 100 pips. If it is a bad, difficult day, I try to make my 50 pips and then I just watch the market. If the situation improves - I go ahead, if not - I have at least my 50 pips. If it is a good trendy day, I try to make 100 pips, and after that I usually stop trading. Yes, sometimes I break this rule if I know that tomorrow will be a difficult day, but that's it.
So, when you decide to trade or not to trade, you have to take into the consideration:
a). Whether it is a holiday or not
b). Whether it is a news time or not
c). Whether it is the right time of the day or not
d). Whether it is trending or ranging
e). Whether you already met your daily goal or not.
3. Babon-H1 template
So we decided to trade. We open Babon-H1 template. We use Babon-H1 template:
a). to watch and interpret H1 Price Action
b). to watch and interpret Heiken Ashi and TDI
c). to watch and interpret TMA H1 and TMA H4 patterns
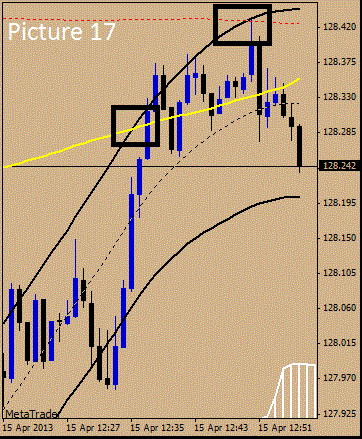
If you downloaded Babon-H1 correctly, it must look like Picture 1
4. Getting the big picture with H1's Price Action
With Babon for us "the big picture" is even more important than the trend. Trading M1 we don't want to trade against the H1 trend, however we want to use good H1 pullbacks and, of course, we want to see H1's trend-changing in advance. For example, if we see a good H1 dodji or a good H1 pinbar, we understand that our M1 trading has to be changed too.
Whatever we do, Price Action is the King! We determine the trend, pullbacks and trend's changes and the whole big picture mostly based on Price Action.
Price Action is a very vast subject, it is impossible for me to teach you Price Action (either for M1 or for H1) inside the Babon system, I recommend to read Lance Beggs Volume 2 and Volume 3, they contain everything we need.
Thanks to Artem you can find Volume 2 and Volume 3 in this post (post 2178, page 146)
http://www.forexfactory.com/showthre...69#post6604669
The complete course is here, thank you, jackey!
http://www.forexfactory.com/showthre...39#post6599639
Before you mastered Price Action try at least to watch dodji and pinbars and remember that a long hour candle (50+ pips) usually causes a pullback.
5. Getting the big picture with simplified TMS
I understand that for many of you H1's Price Action is a very difficult subject, that's why I included TDI and Heiken Ashi.
You don't need any pictures, just open the template and go through the history.
Many of you read TMS thread, and of course I'll give you a very simplified version but this version works just fine for me and it will work just fine for you too! We don't want to trade TMS, we want to trade Babon! So here's a simplified version:
a). If the green line crossed red line up and Heiken Ashi is white - it is trend up. I prefer if such a cross happened near 32 level (the closer to 32, the better).
b). If the green line crossed red line down and Heiken Ashi is red - it is trend down. I prefer if such a cross happened near 68 level (the closer to 68, the better).
c). The bigger the angle between the green line and the horizontal line - the better. If the green line is almost horizontal itself - that means ranging, or possible pullback, or trend-changing.
d). If the green line makes a "hook" in the opposite direction - that means possible pullback or trend-changing.
e). If the distance between the red line and green line becomes too big, more than 10 - that practically always means pullback or trend-changing.
f). When up-trending green line reaches level 68 that means that the movement is closer to the end
g). When down-trending green line reaches level 32 that means that the movement is closer to the end.
h). Pay attention to the size of the Heiken Ashi candles! Several small candles in a row means ranging, big candles - good momentum, decreasing candles - possible pullback or trend-changing.
i). And now very important thing: after you're done with H1 - go to H4 and analyze it the same way. If H4 TMS shows the same direction as H1 TMS - that's great, go for this direction! If TMS H4 shows different direction, you go with the H1 direction, but as a big picture you remember: H1 and H4 are not in agreement, that means that you have to set smaller targets!
6. TMA H1 and TMA H4 patterns
So, with Price Action or with the simplified TMS version, or with both you understand what is going on. You know what the trend is, whether we have consolidation ot not, whether we expect pullback/trend-changing or not etc. Now you have to make your big picture even more precise and more clear with the TMA H1 and TMA H4 patterns. We have five such patterns.
7. Pattern "Center line"
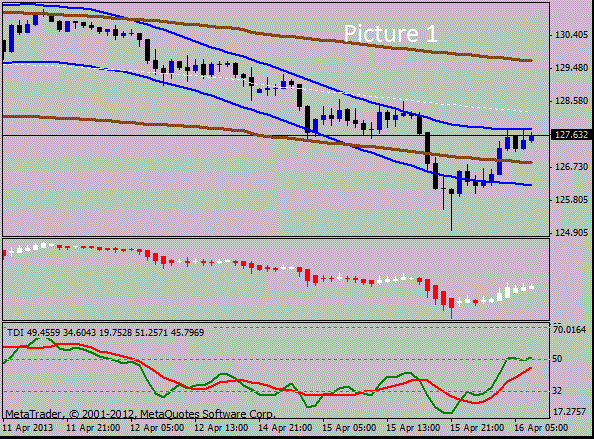
See Picture 2
The upper and lower borders of TMA H4 are brown, and the center line is a dotted white line. TMA H4's centerline is a very strong S/R. When price is near center line it can go back and force for hours and hours, and we have to take this pattern into consideration. I usually exit when price touches the center line, and after that I wait for either a good break out or a good bounce. When price is near center line for the smaller timeframes that means ranging, and I already explained about ranging.
8. Pattern "Double breakout"
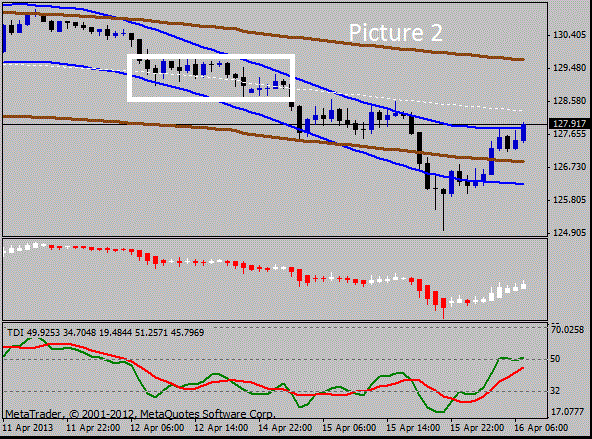
See Picture 3
a). Price is close to TMA H1
b). TMA H1 and TMA H4 are close, but TMA H1 is not beyond TMA H4.
c). Price goes towards TMA H1 border and TMA H4 border
In that case price usually makes a very good movement, breaks both TMA H1 and TMA H4 and goes much further.
9. Pattern "TMA H1 beyond TMA H4"
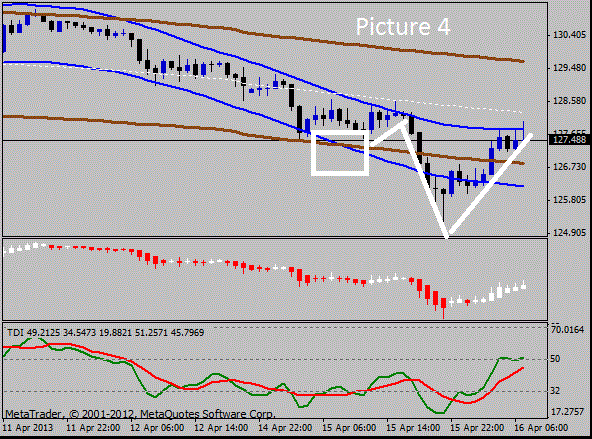
See Picture 4 - click on the attachment Attachment
When TMA H1 goes beyond TMA H4 it usually starts a very unpleasant time. We know that EVENTUALLY trend has to change, but every time we have a pullback we don't have any idea - is it the beginning of the trend-changing or just a small pullback? Ideally we would want to stay out of the market, but this period can last a very long time, so if we want to trade effectively we have to pay a lot of attention to Price Action, Heiken Ashi and TDI.
10. Pattern "TMA H1 and TMA H4 in agreement"
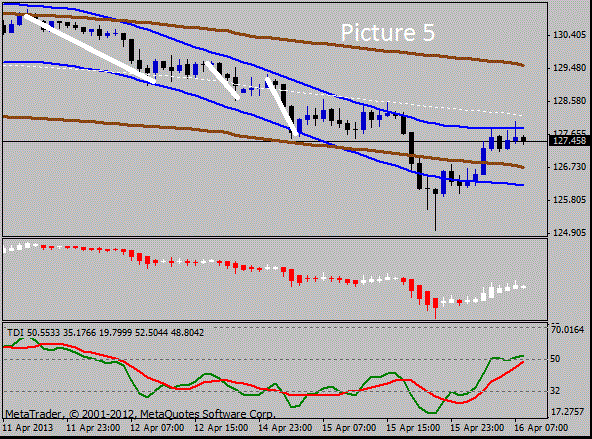
See Picture 5 - click on the attachment Attachment
We don't care about TMA H1 slope and TMA H4 slope. What is important: is the price moves in the same direction inside TMA H1 and TMA H4?
If price goes from the TMA H4 upper border toward its lower border we want price go from the TMA H1 upper border toward its lower border too. And if price goes from the TMA H4 lower border toward its upper border we want price go from the TMA H1 lower border toward its upper border too.
Picture 5 shows where TMA H1 and TMA H4 in agreement, going from the upper borders to the lower borders.
When TMA H1 and TMA H4 are in agreement - that is a good thing, we can expect good movements.
11. Pattern "TMA H1 and TMA H4 in disagreement"
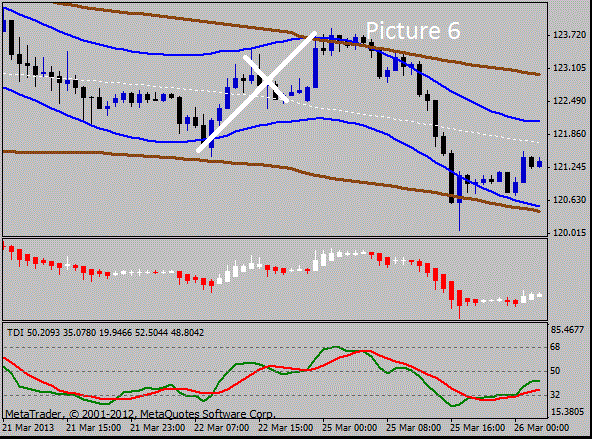
See Picture 6 - click on the attachment Attachment
Direct opposite to the previous pattern. Price inside the TMA H1 goes against the TMA H4 movement. Picture shows that the price goes from the lower TMA H4 border to the upper TMA H4 border (bigger line) and yet inside TMA H1 it changes direction and goes down (small line).
TMA H1 and TMA H4 in disagreement is not very good for trading, sometimes it starts consolidation, besides we never know when the price inside TMA H1 starts changing direction.
12. Putting everything together.
After you got big picture with PA and/or with simplified TMS and made it even more clear with TMA H1 and TMA H4 patterns, you have to know exactly (that's the goal of this analyses):
a). You want to take only long signals
or
b). You want to take only short signals
or
c). You don't want to take any signals at all
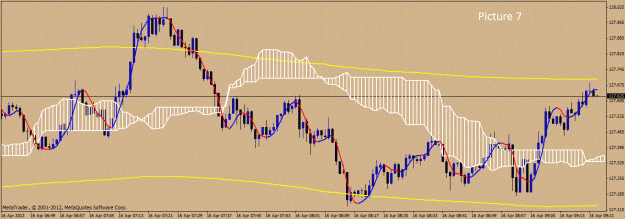
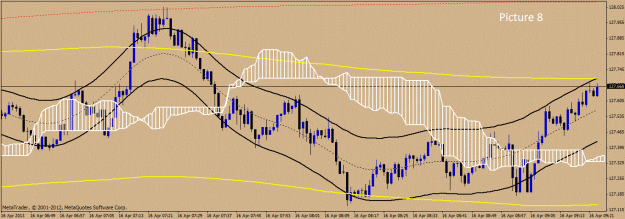
13. Switching to M1
After that you start working with M1 charts, with Babon-A and Babon-B templates.
They must look like Pictures 7 and 8. Click on the attachments: Attachment Attachment
Babon-A is our main template, it contains only three indicators (Babon Slope, TMA M5 and Ichimoku). We use this template for watching Price Action, for watching Babon Slope's signals and for entering according to the "Classic Babon"s rules.
Babon-B contains Ichimoku and three TMAs (TMA M1, TMA M5 and TMA M15) that make our exits much easier and much more profitable. We use this template for watching two TMA patterns ("TMA M1 beyond the Ichimoku cloud" and "TMA M1 beyond TMA M5/M15"), for entering according to these patterns and for watching three TMAs for the profitable exits.
14. "Classic" Babon - Entry Rules
After we got the big picture we know whether we wait for a long Babon signal or for a short Babon signal.
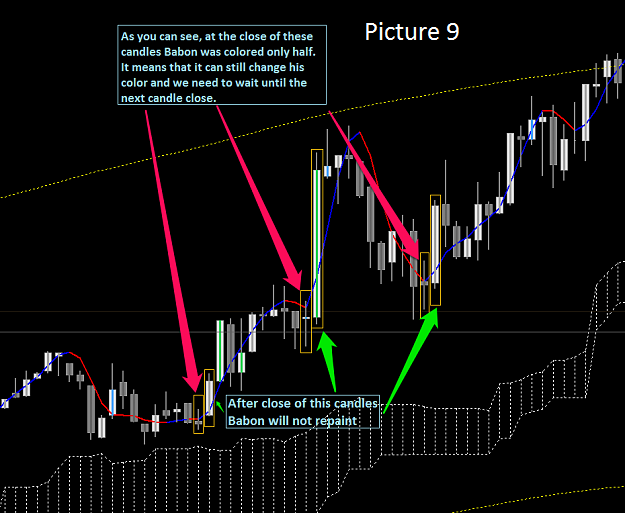
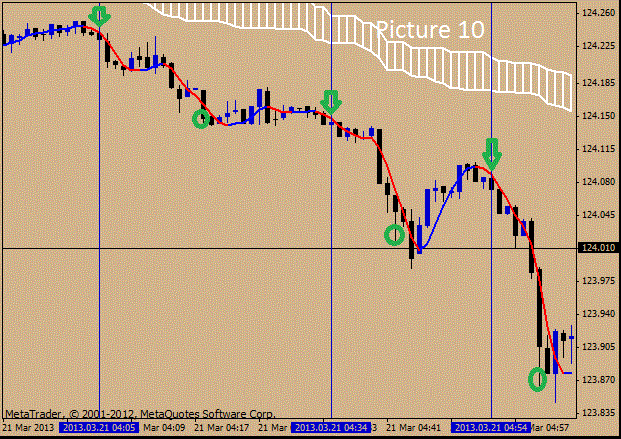
Babon Slope can change its color as long as the candle isn't closed. That's why for us the confirmed signal is the second candle. If the color changed from red to blue, the second "blue candle" is a signal candle for going long. If the color changed from blue to red, the second "red candle" is a signal candle for going short.
Please look at the Pictures 9 and 10 (thank you, Artem) - click on the attachments Attachment Attachment
After we got a confirmed Babon Slope's signal, we have to validate it. Let's say that after getting the big picture we decided to take only long signals and now we've got the long Babon Slope's signal (for the short signals everything's the opposite).
So, if it is a long signal:
a). The price must be above the Ichimoku cloud, or we can wait price going above the cloud, but in that case we can wait only 3-4 candles.
b). We want to see the price going from the lower TMA M5 border to the upper TMA M5 border
c). The TMA M5 channel has to have the right angle: it can go up or it can be horizontal (or at least almost horizontal), but for the long signal we don't want to see TMA M5 channel going down.
d). Then we determine whether this trade has a good potential. We look at the distance between the price and the upper TMA M5 band (the upper yellow line). Yes, TMA M5 repaints, but it repaints less than TMA M1, it is much more stable and steady than TMA M1, and this distance between the price and the upper yellow line is very important. Basically the more the distance is, the more potential this trade has. At M1 price usually goes more or less between the upper TMA M5 band and the lower TMA M5 band, it can go much further if the trend is good, but we can't rely on it. If the distance between the price and the upper yellow band is less than 10 pips there are good chances that we won't get even those 10 pips and that this upper line would work like a strong resistance.
e). Very important to pay attention to the previous candle, don't enter if the previous candle is 10+ pips! It is very important because the candle that is too long can cause a fake Babon Slope's signal! Besides M1 10+ pips candle usually causes a pullback, we don't want it, we want to enter with the smallest drawdown possible.
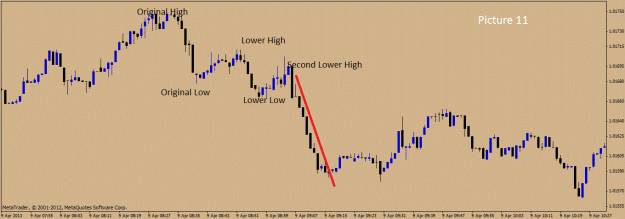
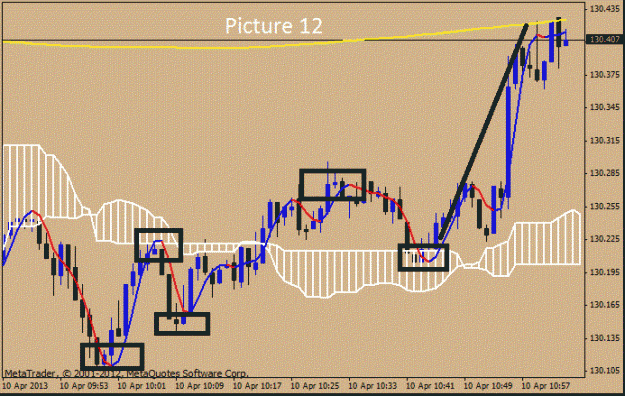
f). We also want to see the right M1 Price Action, for the long signal we want to see higher highs and higher lows (for the short signal - lower lows and lower highs). Please see Pictures 11 and 12 - click on the attachments Attachment Attachment
And I do recommend to read Lance Beggs on Price Action, Volumes 2 and 3, I already gave the link.
g). Then we double-check H1. We look at Babon-H1, if H1 shows the trend up or if it was a trend down but now the price started going up, then we can decide that basically H1 supports our decision to go long.
h). So, if everything is right, we enter. I recommend SL (or lock) 15 pips for EURJPY and GBPJPY, 12 pips for EURUSD, GBPUSD etc. I recommend 15 pips emergency stop, I personally use locks, but it doesn't matter - you have to have either SL or lock, I would never trade without that, and the currency doesn't matter - I've seen USDCAD making 100+ move in a couple of minutes. We don't need TP. Now we have to watch both templates, Babon-A and Babon-B, it is also a good idea to keep Babon-H1 open too.
15. Classic Babon - Exit Rules
If everything is OK and the price goes up, we want to exit depending on the strength of the movement. If the trend is so-so, we'd better exit when the price at Babon-B M1 crosses TMA M1 upper band (the upper black line). If the trend is good, we want to wait at least until the price crosses TMA M5 (the upper yellow line). If the trend is very good, we can wait until the price crosses TMA M15 (the upper red line). At the same time we have to pay attention to H1: how close is the price to the blue line (TMA H1)? Sometimes when the trend is not just very good, but excellent, we can exit when the price crosses the blue H1 line. Whatever the TMA is, I usually try to exit at the end of the minute.
But at the same time we have to remember - if Babon Slope changes color to red or if the price went under Babon Slope's line, it is a very good sign that the up-movement is over or almost over. Yes, sometimes I don't exit because my TMA lines show that I'd better wait, but you need a lot of practice to decide what is more important at the moment - the movement's strength and momentum or the Babon's signal.
We also have to remember - if the price goes inside the Ichimoku cloud, we'd better exit.
I also exit if the M1 candle is too long and this long candle crossed one of the TMAs.
And, of course, if we see that the price went against us, we'd better exit with a small profit or a small loss, after all we can always re-enter if the situation improves.
Even if we entered according to the Classic Babon Rules, we have to watch out for two TMA M1 patterns on the Babon-B template. If we see "TMA M1 beyond TMA M5/M15", we'd better think about profit-taking, because the pullback is coming. On the other hand, if we see a good "TMA M1 beyond the Ichimoku cloud" pattern forming, we can stay in the trend much longer than we expected in the first place.
I prefer to exit when the price crosses TMA M5 or TMA M15. I have to see a very good and strong movement to decide to go to TMA H1. But if I think there is a possibility to go to TMA H1 or even to TMA H4, I double-check my H1. First of all I want to know that we are not near the TMA H4 center line (white line). This center line is a very strong S/R. If the center line is OK I look at the TMA H1 and TMA H4. I want to see that the price inside TMA H1 and inside TMA H4 goes in the same direction. The angle of the slope doesn't matter, only the price's direction is important! So if I think that we can go as low as the TMA H1 lower border, I want to see the price going from the TMA H4 upper border toward it's lower border and I want to see the price going from the TMA H1 upper border toward the lower border. And, of course, I watch for the "Double breakout" pattern.
16. Pattern "TMA M1 beyond the Ichimoku cloud"
See Picture 13 and Picture 14 - click on the attachments Attachment Attachment
It is a very important and a very profitable pattern!
When the whole TMA M1 channel (both the upper border and the lower border) goes under the Ichimoku cloud and the channel is NOT horizontal, then we can expect a very good and profitable short trade.
And, of course, when the whole TMA M1 channel (both the upper border and the lower border) goes above the Ichimoku cloud and the channel is NOT horizontal, then we can expect a very good and profitable long trade.
A good thing about this pattern is that even when we see only the TMA M1 center line crosses the cloud we already anticipate the pattern formation and can get ready, checking M1 Price Action and H1's "big picture".
We can trade this pattern independently, we don't have to follow the Classic Babon Rules.
To enter with this pattern we want to see three things:
a). The right H1 "big picture"
b). A good TMA M1 angle
c). A good M1 Price Action
And we can enter not only if we see a Babon Slope signal, but also independently, based on M1 Price Action only.
I enter when I see a good M1 Price Action pattern, and for this kind of trading it could be not only higher low - lower high, but any good M1 Price action pattern, for example a breakout.
If we see a good signal but the signal candle is 10 pips or more, then we wouldn't enter, we wait a little bit and watch the price action before we enter.
It is because my experience says: on M1 after a long (10+ pips) candle we usually have a pullback, so we don't want to enter under the worst conditions, we want to wait and decrease the possible drawdown.
SL, TP and exit - exactly as in Classic Babon.
This pattern is probably the best method I've ever created. When we get a Dashboard, we'll be able to watch 8-10 pairs and choose the best patterns.
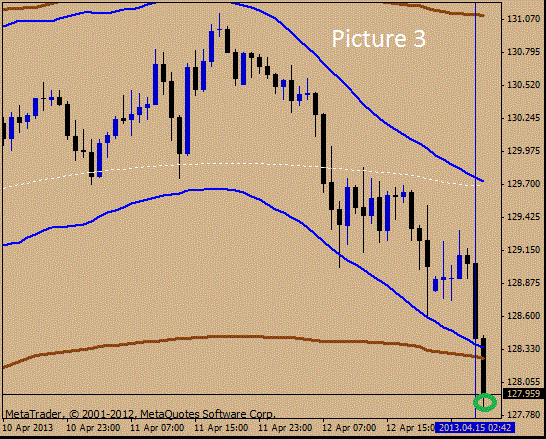
17. Pattern "TMA M1 beyond TMA M5/M15"
See Pictures 15, 16 and 17. Click on the attachments: Attachment Attachment Attachment
When after a good trend TMA M1 goes beyond TMA M5 or it goes even beyond both TMA M5 and TMA M15, then we have either a pullback or even a trend's change! This pullback can be as small as 8-10 pips or as big as 30+ pips, but we have to have this pullback at any case!
What does that mean?
First of all, when we see this pattern, we know that in a little while we'll have a pullback, so if we have an open trade, we have to think about closing it taking our profits. Of course, the pullback won't start immediately after we see the pattern, there will be a little while, we can get almost maximal profit and exit when the Babon or Price Action or our experience tells us to do that!
Second, some of you can try to trade this pullback. I personally don't trade this pattern's pullbacks, I use this pattern only to get out, but I do know traders who trade this pullback successfully. You can get 8-10 pips practically every time, just remember that it is a counter-trend and don't be greedy.
Third, if the trend is strong, we can re-enter after the pullback is over (the Babon and Price Action will show us where and when). I trade those re-entries after pullbacks successfully.
If the TMA M1 went not only beyond TMA M5, but also beyond TMA M15, we usually have much stronger pullback than if it just TMA M5.
Even when we see TMA M1 beyond TMA M5 we could stay for a little while IF the TMA M1's angle (the slope) is still good at the pattern "TMA M1 beyond the Ichimoku cloud"!
18. Classic Babon - trades and illustrations
http://www.forexfactory.com/showthre...11#post6543511
http://www.forexfactory.com/showthre...84#post6543784
http://www.forexfactory.com/showthre...80#post6544780
http://www.forexfactory.com/showthre...65#post6546865
http://www.forexfactory.com/showthre...54#post6547054
http://www.forexfactory.com/showthre...75#post6550475
http://www.forexfactory.com/showthre...72#post6550672
http://www.forexfactory.com/showthre...38#post6550738
http://www.forexfactory.com/showthre...47#post6550747
http://www.forexfactory.com/showthre...72#post6551872
http://www.forexfactory.com/showthre...76#post6567876
http://www.forexfactory.com/showthre...47#post6567947
http://www.forexfactory.com/showthre...58#post6571958
http://www.forexfactory.com/showthre...28#post6583628
http://www.forexfactory.com/showthre...92#post6583692
http://www.forexfactory.com/showthre...16#post6583716
http://www.forexfactory.com/showthre...14#post6583914
http://www.forexfactory.com/showthre...55#post6584755
http://www.forexfactory.com/showthre...80#post6586480
http://www.forexfactory.com/showthre...22#post6586622
http://www.forexfactory.com/showthre...51#post6586651
http://www.forexfactory.com/showthre...90#post6586690
http://www.forexfactory.com/showthre...25#post6587625
http://www.forexfactory.com/showthre...07#post6588707
http://www.forexfactory.com/showthre...84#post6589984
http://www.forexfactory.com/showthre...93#post6590893
http://www.forexfactory.com/showthre...44#post6591044
http://www.forexfactory.com/showthre...20#post6593420
http://www.forexfactory.com/showthre...85#post6593985
http://www.forexfactory.com/showthre...61#post6595661
http://www.forexfactory.com/showthre...86#post6595886
http://www.forexfactory.com/showthre...31#post6596131
http://www.forexfactory.com/showthre...38#post6603738
http://www.forexfactory.com/showthre...01#post6603901
http://www.forexfactory.com/showthre...22#post6611722
19. "TMA M1 beyond the Ichimoku cloud" - trades and illustrations
http://www.forexfactory.com/showthre...84#post6551084
http://www.forexfactory.com/showthre...92#post6551992
http://www.forexfactory.com/showthre...93#post6554093
http://www.forexfactory.com/showthre...40#post6554140
http://www.forexfactory.com/showthre...26#post6554726
http://www.forexfactory.com/showthre...62#post6564962
http://www.forexfactory.com/showthre...37#post6566037
http://www.forexfactory.com/showthre...26#post6567726
http://www.forexfactory.com/showthre...38#post6569038
http://www.forexfactory.com/showthre...07#post6569107
http://www.forexfactory.com/showthre...74#post6586774
http://www.forexfactory.com/showthre...92#post6590292
http://www.forexfactory.com/showthre...27#post6590327
http://www.forexfactory.com/showthre...49#post6603749
http://www.forexfactory.com/showthre...76#post6603976
http://www.forexfactory.com/showthre...26#post6604026
http://www.forexfactory.com/showthre...19#post6607719
http://www.forexfactory.com/showthre...90#post6608590
http://www.forexfactory.com/showthre...96#post6608796
http://www.forexfactory.com/showthre...16#post6611316
20. Naked pattern trading with "TMA M1 beyond the Ichimoku cloud" - trades and illustrations
http://www.forexfactory.com/showthre...98#post6597898
http://www.forexfactory.com/showthre...64#post6598064
http://www.forexfactory.com/showthre...46#post6603546
http://www.forexfactory.com/showthre...07#post6603607
http://www.forexfactory.com/showthre...40#post6603840
http://www.forexfactory.com/showthre...00#post6605000
http://www.forexfactory.com/showthre...07#post6611207
http://www.forexfactory.com/showthre...74#post6611474
http://www.forexfactory.com/showthre...07#post6611507
http://www.forexfactory.com/showthre...15#post6611515
http://www.forexfactory.com/showthre...13#post6611913
21. Pattern "TMA M1 beyond TMA M5/M15" - trades and illustrations
http://www.forexfactory.com/showthre...62#post6604862
http://www.forexfactory.com/showthre...78#post6605078
http://www.forexfactory.com/showthre...46#post6598746
http://www.forexfactory.com/showthre...07#post6603607
http://www.forexfactory.com/showthre...90#post6603990
http://www.forexfactory.com/showthre...17#post6608417
http://www.forexfactory.com/showthre...86#post6608586
http://www.forexfactory.com/showthre...46#post6609046
http://www.forexfactory.com/showthre...96#post6609196
http://www.forexfactory.com/showthre...28#post6611228
http://www.forexfactory.com/showthre...50#post6611550
http://www.forexfactory.com/showthre...32#post6611932
http://www.forexfactory.com/showthre...31#post6612531
http://www.forexfactory.com/showthre...45#post6612645
DNA created a very nice PDF of this post, you can download it here:
http://www.forexfactory.com/showthre...43#post6610243
And there is an even better news! hollowhead created a PDF that contains all the examples and all the illustrations!
http://www.forexfactory.com/showthre...21#post6613121
Right now I trade with Babon only EURJPY, but the system works just fine if you trade GBPJPY, EURUSD, GBPUSD. I'm sure other pairs would do just fine too. Later, when we have a Dashboard, I'll be trading more pairs.
M1 trading contains three parts - Classic Babon, pattern "TMA M1 beyond the Ichimoku cloud" and "TMA M1 beyond TMA M5/M15", you can trade any of them individually or two of them or all three.
Babon system is a two-step operation. First we get the big picture, then we go to M1.
We have three templates. Babon-H1 is for getting big picture, Babon-A and Babon-B are for M1.
Template Babon-A is the same I uploaded in the post #930, and TMA and Babon Slope are the same I posted in post #930.
Template Babon-H1 is a new one, TDI Red Green and Heiken Ashi are the new indicators too, so you have to download all this stuff.
Template Babon-B is a little different comparing to the post #930, TMA M1 shows it's center line (dotted black line), and I got rid of the TMA H1 and TMA H4, so you'd better replace the old one by the new one.
2. When to trade and when not to trade
First of all, even before we open any charts we have to decide - is it the right time for trading? If it is not - we just don't trade, just that simple! It sounds funny, but if the trader doesn't know when he'd better stay out of the market, he's gonna lose!
There are days when the market is too "thin". We'd better stay out of the market on big holidays (New Year, Good Friday, 4th of July, Labor Day, Thanksgiving Day, Cristmas) and on bank holidays.
There are news that can screw up any trading. I don't trade Non-Farm Fridays (the whole day).
There are news that are important and we'd better watch out. I recommend to stop trading 30-60 minutes before the important news and stay out of the market for at least one hour after the news. For me the important news are: Unemployment Claims, important meetings and important press-conferences (BOJ, Draghi, Bernanke etc.). That's it! I don't think all so called "red news" are important! Only high-impact news are important! And, of course, if you trade a currency like AUDUSD, GBPUSD etc. you have to watch out for this currency's rate change, for a particular currency that would be a high-impact news too!
Time of the day is very important too! I personally usually trade from approximately 11:30 PM EST to 11:00 AM EST, I try not to open any new trades after 10:00 AM EST. I think if you trade EURJPY or GBPJPY you can start even much earlier, maybe at 7:00 PM EST. But whatever you trade I don't recommend trading between 11:00 AM EST and 7:00 PM EST. Yes, there are days when you can make very good pips trading in the afternoon, but usually after the Europe is closed and America goes to lunch the market becomes "thin", you don't want to trade at this time.
And, of course, you don't want to trade when the market is ranging! With Babon we have to goals:
a). When it is trending our goal is to make a very good amount of pips (but don't be too greedy).
b). When it is ranging our goal is not to lose (play it safe).
Now about this greed. I recommend to have two daily goals, the moderate one and the big one. For example my moderate daily goal is 50 pips and my big daily goal is 100 pips. If it is a bad, difficult day, I try to make my 50 pips and then I just watch the market. If the situation improves - I go ahead, if not - I have at least my 50 pips. If it is a good trendy day, I try to make 100 pips, and after that I usually stop trading. Yes, sometimes I break this rule if I know that tomorrow will be a difficult day, but that's it.
So, when you decide to trade or not to trade, you have to take into the consideration:
a). Whether it is a holiday or not
b). Whether it is a news time or not
c). Whether it is the right time of the day or not
d). Whether it is trending or ranging
e). Whether you already met your daily goal or not.
3. Babon-H1 template
So we decided to trade. We open Babon-H1 template. We use Babon-H1 template:
a). to watch and interpret H1 Price Action
b). to watch and interpret Heiken Ashi and TDI
c). to watch and interpret TMA H1 and TMA H4 patterns
If you downloaded Babon-H1 correctly, it must look like Picture 1
Attached Image
4. Getting the big picture with H1's Price Action
With Babon for us "the big picture" is even more important than the trend. Trading M1 we don't want to trade against the H1 trend, however we want to use good H1 pullbacks and, of course, we want to see H1's trend-changing in advance. For example, if we see a good H1 dodji or a good H1 pinbar, we understand that our M1 trading has to be changed too.
Whatever we do, Price Action is the King! We determine the trend, pullbacks and trend's changes and the whole big picture mostly based on Price Action.
Price Action is a very vast subject, it is impossible for me to teach you Price Action (either for M1 or for H1) inside the Babon system, I recommend to read Lance Beggs Volume 2 and Volume 3, they contain everything we need.
Thanks to Artem you can find Volume 2 and Volume 3 in this post (post 2178, page 146)
http://www.forexfactory.com/showthre...69#post6604669
The complete course is here, thank you, jackey!
http://www.forexfactory.com/showthre...39#post6599639
Before you mastered Price Action try at least to watch dodji and pinbars and remember that a long hour candle (50+ pips) usually causes a pullback.
5. Getting the big picture with simplified TMS
I understand that for many of you H1's Price Action is a very difficult subject, that's why I included TDI and Heiken Ashi.
You don't need any pictures, just open the template and go through the history.
Many of you read TMS thread, and of course I'll give you a very simplified version but this version works just fine for me and it will work just fine for you too! We don't want to trade TMS, we want to trade Babon! So here's a simplified version:
a). If the green line crossed red line up and Heiken Ashi is white - it is trend up. I prefer if such a cross happened near 32 level (the closer to 32, the better).
b). If the green line crossed red line down and Heiken Ashi is red - it is trend down. I prefer if such a cross happened near 68 level (the closer to 68, the better).
c). The bigger the angle between the green line and the horizontal line - the better. If the green line is almost horizontal itself - that means ranging, or possible pullback, or trend-changing.
d). If the green line makes a "hook" in the opposite direction - that means possible pullback or trend-changing.
e). If the distance between the red line and green line becomes too big, more than 10 - that practically always means pullback or trend-changing.
f). When up-trending green line reaches level 68 that means that the movement is closer to the end
g). When down-trending green line reaches level 32 that means that the movement is closer to the end.
h). Pay attention to the size of the Heiken Ashi candles! Several small candles in a row means ranging, big candles - good momentum, decreasing candles - possible pullback or trend-changing.
i). And now very important thing: after you're done with H1 - go to H4 and analyze it the same way. If H4 TMS shows the same direction as H1 TMS - that's great, go for this direction! If TMS H4 shows different direction, you go with the H1 direction, but as a big picture you remember: H1 and H4 are not in agreement, that means that you have to set smaller targets!
6. TMA H1 and TMA H4 patterns
So, with Price Action or with the simplified TMS version, or with both you understand what is going on. You know what the trend is, whether we have consolidation ot not, whether we expect pullback/trend-changing or not etc. Now you have to make your big picture even more precise and more clear with the TMA H1 and TMA H4 patterns. We have five such patterns.
7. Pattern "Center line"
See Picture 2
The upper and lower borders of TMA H4 are brown, and the center line is a dotted white line. TMA H4's centerline is a very strong S/R. When price is near center line it can go back and force for hours and hours, and we have to take this pattern into consideration. I usually exit when price touches the center line, and after that I wait for either a good break out or a good bounce. When price is near center line for the smaller timeframes that means ranging, and I already explained about ranging.
Attached Image
8. Pattern "Double breakout"
See Picture 3
a). Price is close to TMA H1
b). TMA H1 and TMA H4 are close, but TMA H1 is not beyond TMA H4.
c). Price goes towards TMA H1 border and TMA H4 border
In that case price usually makes a very good movement, breaks both TMA H1 and TMA H4 and goes much further.
Attached Image
9. Pattern "TMA H1 beyond TMA H4"
See Picture 4 - click on the attachment Attachment
When TMA H1 goes beyond TMA H4 it usually starts a very unpleasant time. We know that EVENTUALLY trend has to change, but every time we have a pullback we don't have any idea - is it the beginning of the trend-changing or just a small pullback? Ideally we would want to stay out of the market, but this period can last a very long time, so if we want to trade effectively we have to pay a lot of attention to Price Action, Heiken Ashi and TDI.
10. Pattern "TMA H1 and TMA H4 in agreement"
See Picture 5 - click on the attachment Attachment
We don't care about TMA H1 slope and TMA H4 slope. What is important: is the price moves in the same direction inside TMA H1 and TMA H4?
If price goes from the TMA H4 upper border toward its lower border we want price go from the TMA H1 upper border toward its lower border too. And if price goes from the TMA H4 lower border toward its upper border we want price go from the TMA H1 lower border toward its upper border too.
Picture 5 shows where TMA H1 and TMA H4 in agreement, going from the upper borders to the lower borders.
When TMA H1 and TMA H4 are in agreement - that is a good thing, we can expect good movements.
11. Pattern "TMA H1 and TMA H4 in disagreement"
See Picture 6 - click on the attachment Attachment
Direct opposite to the previous pattern. Price inside the TMA H1 goes against the TMA H4 movement. Picture shows that the price goes from the lower TMA H4 border to the upper TMA H4 border (bigger line) and yet inside TMA H1 it changes direction and goes down (small line).
TMA H1 and TMA H4 in disagreement is not very good for trading, sometimes it starts consolidation, besides we never know when the price inside TMA H1 starts changing direction.
12. Putting everything together.
After you got big picture with PA and/or with simplified TMS and made it even more clear with TMA H1 and TMA H4 patterns, you have to know exactly (that's the goal of this analyses):
a). You want to take only long signals
or
b). You want to take only short signals
or
c). You don't want to take any signals at all
13. Switching to M1
After that you start working with M1 charts, with Babon-A and Babon-B templates.
They must look like Pictures 7 and 8. Click on the attachments: Attachment Attachment
Babon-A is our main template, it contains only three indicators (Babon Slope, TMA M5 and Ichimoku). We use this template for watching Price Action, for watching Babon Slope's signals and for entering according to the "Classic Babon"s rules.
Babon-B contains Ichimoku and three TMAs (TMA M1, TMA M5 and TMA M15) that make our exits much easier and much more profitable. We use this template for watching two TMA patterns ("TMA M1 beyond the Ichimoku cloud" and "TMA M1 beyond TMA M5/M15"), for entering according to these patterns and for watching three TMAs for the profitable exits.
14. "Classic" Babon - Entry Rules
After we got the big picture we know whether we wait for a long Babon signal or for a short Babon signal.
Babon Slope can change its color as long as the candle isn't closed. That's why for us the confirmed signal is the second candle. If the color changed from red to blue, the second "blue candle" is a signal candle for going long. If the color changed from blue to red, the second "red candle" is a signal candle for going short.
Please look at the Pictures 9 and 10 (thank you, Artem) - click on the attachments Attachment Attachment
After we got a confirmed Babon Slope's signal, we have to validate it. Let's say that after getting the big picture we decided to take only long signals and now we've got the long Babon Slope's signal (for the short signals everything's the opposite).
So, if it is a long signal:
a). The price must be above the Ichimoku cloud, or we can wait price going above the cloud, but in that case we can wait only 3-4 candles.
b). We want to see the price going from the lower TMA M5 border to the upper TMA M5 border
c). The TMA M5 channel has to have the right angle: it can go up or it can be horizontal (or at least almost horizontal), but for the long signal we don't want to see TMA M5 channel going down.
d). Then we determine whether this trade has a good potential. We look at the distance between the price and the upper TMA M5 band (the upper yellow line). Yes, TMA M5 repaints, but it repaints less than TMA M1, it is much more stable and steady than TMA M1, and this distance between the price and the upper yellow line is very important. Basically the more the distance is, the more potential this trade has. At M1 price usually goes more or less between the upper TMA M5 band and the lower TMA M5 band, it can go much further if the trend is good, but we can't rely on it. If the distance between the price and the upper yellow band is less than 10 pips there are good chances that we won't get even those 10 pips and that this upper line would work like a strong resistance.
e). Very important to pay attention to the previous candle, don't enter if the previous candle is 10+ pips! It is very important because the candle that is too long can cause a fake Babon Slope's signal! Besides M1 10+ pips candle usually causes a pullback, we don't want it, we want to enter with the smallest drawdown possible.
f). We also want to see the right M1 Price Action, for the long signal we want to see higher highs and higher lows (for the short signal - lower lows and lower highs). Please see Pictures 11 and 12 - click on the attachments Attachment Attachment
And I do recommend to read Lance Beggs on Price Action, Volumes 2 and 3, I already gave the link.
g). Then we double-check H1. We look at Babon-H1, if H1 shows the trend up or if it was a trend down but now the price started going up, then we can decide that basically H1 supports our decision to go long.
h). So, if everything is right, we enter. I recommend SL (or lock) 15 pips for EURJPY and GBPJPY, 12 pips for EURUSD, GBPUSD etc. I recommend 15 pips emergency stop, I personally use locks, but it doesn't matter - you have to have either SL or lock, I would never trade without that, and the currency doesn't matter - I've seen USDCAD making 100+ move in a couple of minutes. We don't need TP. Now we have to watch both templates, Babon-A and Babon-B, it is also a good idea to keep Babon-H1 open too.
15. Classic Babon - Exit Rules
If everything is OK and the price goes up, we want to exit depending on the strength of the movement. If the trend is so-so, we'd better exit when the price at Babon-B M1 crosses TMA M1 upper band (the upper black line). If the trend is good, we want to wait at least until the price crosses TMA M5 (the upper yellow line). If the trend is very good, we can wait until the price crosses TMA M15 (the upper red line). At the same time we have to pay attention to H1: how close is the price to the blue line (TMA H1)? Sometimes when the trend is not just very good, but excellent, we can exit when the price crosses the blue H1 line. Whatever the TMA is, I usually try to exit at the end of the minute.
But at the same time we have to remember - if Babon Slope changes color to red or if the price went under Babon Slope's line, it is a very good sign that the up-movement is over or almost over. Yes, sometimes I don't exit because my TMA lines show that I'd better wait, but you need a lot of practice to decide what is more important at the moment - the movement's strength and momentum or the Babon's signal.
We also have to remember - if the price goes inside the Ichimoku cloud, we'd better exit.
I also exit if the M1 candle is too long and this long candle crossed one of the TMAs.
And, of course, if we see that the price went against us, we'd better exit with a small profit or a small loss, after all we can always re-enter if the situation improves.
Even if we entered according to the Classic Babon Rules, we have to watch out for two TMA M1 patterns on the Babon-B template. If we see "TMA M1 beyond TMA M5/M15", we'd better think about profit-taking, because the pullback is coming. On the other hand, if we see a good "TMA M1 beyond the Ichimoku cloud" pattern forming, we can stay in the trend much longer than we expected in the first place.
I prefer to exit when the price crosses TMA M5 or TMA M15. I have to see a very good and strong movement to decide to go to TMA H1. But if I think there is a possibility to go to TMA H1 or even to TMA H4, I double-check my H1. First of all I want to know that we are not near the TMA H4 center line (white line). This center line is a very strong S/R. If the center line is OK I look at the TMA H1 and TMA H4. I want to see that the price inside TMA H1 and inside TMA H4 goes in the same direction. The angle of the slope doesn't matter, only the price's direction is important! So if I think that we can go as low as the TMA H1 lower border, I want to see the price going from the TMA H4 upper border toward it's lower border and I want to see the price going from the TMA H1 upper border toward the lower border. And, of course, I watch for the "Double breakout" pattern.
16. Pattern "TMA M1 beyond the Ichimoku cloud"
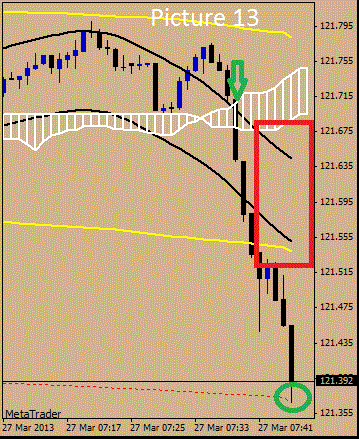
See Picture 13 and Picture 14 - click on the attachments Attachment Attachment
It is a very important and a very profitable pattern!
When the whole TMA M1 channel (both the upper border and the lower border) goes under the Ichimoku cloud and the channel is NOT horizontal, then we can expect a very good and profitable short trade.
And, of course, when the whole TMA M1 channel (both the upper border and the lower border) goes above the Ichimoku cloud and the channel is NOT horizontal, then we can expect a very good and profitable long trade.
A good thing about this pattern is that even when we see only the TMA M1 center line crosses the cloud we already anticipate the pattern formation and can get ready, checking M1 Price Action and H1's "big picture".
We can trade this pattern independently, we don't have to follow the Classic Babon Rules.
To enter with this pattern we want to see three things:
a). The right H1 "big picture"
b). A good TMA M1 angle
c). A good M1 Price Action
And we can enter not only if we see a Babon Slope signal, but also independently, based on M1 Price Action only.
I enter when I see a good M1 Price Action pattern, and for this kind of trading it could be not only higher low - lower high, but any good M1 Price action pattern, for example a breakout.
If we see a good signal but the signal candle is 10 pips or more, then we wouldn't enter, we wait a little bit and watch the price action before we enter.
It is because my experience says: on M1 after a long (10+ pips) candle we usually have a pullback, so we don't want to enter under the worst conditions, we want to wait and decrease the possible drawdown.
SL, TP and exit - exactly as in Classic Babon.
This pattern is probably the best method I've ever created. When we get a Dashboard, we'll be able to watch 8-10 pairs and choose the best patterns.
17. Pattern "TMA M1 beyond TMA M5/M15"
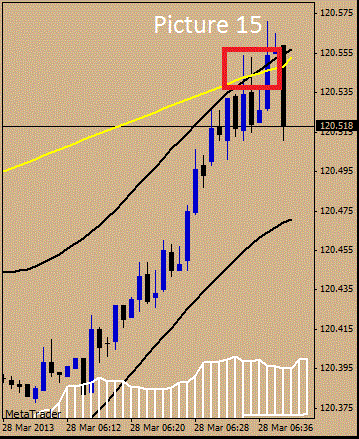
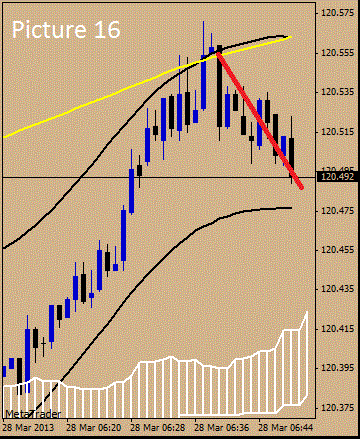
See Pictures 15, 16 and 17. Click on the attachments: Attachment Attachment Attachment
When after a good trend TMA M1 goes beyond TMA M5 or it goes even beyond both TMA M5 and TMA M15, then we have either a pullback or even a trend's change! This pullback can be as small as 8-10 pips or as big as 30+ pips, but we have to have this pullback at any case!
What does that mean?
First of all, when we see this pattern, we know that in a little while we'll have a pullback, so if we have an open trade, we have to think about closing it taking our profits. Of course, the pullback won't start immediately after we see the pattern, there will be a little while, we can get almost maximal profit and exit when the Babon or Price Action or our experience tells us to do that!
Second, some of you can try to trade this pullback. I personally don't trade this pattern's pullbacks, I use this pattern only to get out, but I do know traders who trade this pullback successfully. You can get 8-10 pips practically every time, just remember that it is a counter-trend and don't be greedy.
Third, if the trend is strong, we can re-enter after the pullback is over (the Babon and Price Action will show us where and when). I trade those re-entries after pullbacks successfully.
If the TMA M1 went not only beyond TMA M5, but also beyond TMA M15, we usually have much stronger pullback than if it just TMA M5.
Even when we see TMA M1 beyond TMA M5 we could stay for a little while IF the TMA M1's angle (the slope) is still good at the pattern "TMA M1 beyond the Ichimoku cloud"!
18. Classic Babon - trades and illustrations
http://www.forexfactory.com/showthre...11#post6543511
http://www.forexfactory.com/showthre...84#post6543784
http://www.forexfactory.com/showthre...80#post6544780
http://www.forexfactory.com/showthre...65#post6546865
http://www.forexfactory.com/showthre...54#post6547054
http://www.forexfactory.com/showthre...75#post6550475
http://www.forexfactory.com/showthre...72#post6550672
http://www.forexfactory.com/showthre...38#post6550738
http://www.forexfactory.com/showthre...47#post6550747
http://www.forexfactory.com/showthre...72#post6551872
http://www.forexfactory.com/showthre...76#post6567876
http://www.forexfactory.com/showthre...47#post6567947
http://www.forexfactory.com/showthre...58#post6571958
http://www.forexfactory.com/showthre...28#post6583628
http://www.forexfactory.com/showthre...92#post6583692
http://www.forexfactory.com/showthre...16#post6583716
http://www.forexfactory.com/showthre...14#post6583914
http://www.forexfactory.com/showthre...55#post6584755
http://www.forexfactory.com/showthre...80#post6586480
http://www.forexfactory.com/showthre...22#post6586622
http://www.forexfactory.com/showthre...51#post6586651
http://www.forexfactory.com/showthre...90#post6586690
http://www.forexfactory.com/showthre...25#post6587625
http://www.forexfactory.com/showthre...07#post6588707
http://www.forexfactory.com/showthre...84#post6589984
http://www.forexfactory.com/showthre...93#post6590893
http://www.forexfactory.com/showthre...44#post6591044
http://www.forexfactory.com/showthre...20#post6593420
http://www.forexfactory.com/showthre...85#post6593985
http://www.forexfactory.com/showthre...61#post6595661
http://www.forexfactory.com/showthre...86#post6595886
http://www.forexfactory.com/showthre...31#post6596131
http://www.forexfactory.com/showthre...38#post6603738
http://www.forexfactory.com/showthre...01#post6603901
http://www.forexfactory.com/showthre...22#post6611722
19. "TMA M1 beyond the Ichimoku cloud" - trades and illustrations
http://www.forexfactory.com/showthre...84#post6551084
http://www.forexfactory.com/showthre...92#post6551992
http://www.forexfactory.com/showthre...93#post6554093
http://www.forexfactory.com/showthre...40#post6554140
http://www.forexfactory.com/showthre...26#post6554726
http://www.forexfactory.com/showthre...62#post6564962
http://www.forexfactory.com/showthre...37#post6566037
http://www.forexfactory.com/showthre...26#post6567726
http://www.forexfactory.com/showthre...38#post6569038
http://www.forexfactory.com/showthre...07#post6569107
http://www.forexfactory.com/showthre...74#post6586774
http://www.forexfactory.com/showthre...92#post6590292
http://www.forexfactory.com/showthre...27#post6590327
http://www.forexfactory.com/showthre...49#post6603749
http://www.forexfactory.com/showthre...76#post6603976
http://www.forexfactory.com/showthre...26#post6604026
http://www.forexfactory.com/showthre...19#post6607719
http://www.forexfactory.com/showthre...90#post6608590
http://www.forexfactory.com/showthre...96#post6608796
http://www.forexfactory.com/showthre...16#post6611316
20. Naked pattern trading with "TMA M1 beyond the Ichimoku cloud" - trades and illustrations
http://www.forexfactory.com/showthre...98#post6597898
http://www.forexfactory.com/showthre...64#post6598064
http://www.forexfactory.com/showthre...46#post6603546
http://www.forexfactory.com/showthre...07#post6603607
http://www.forexfactory.com/showthre...40#post6603840
http://www.forexfactory.com/showthre...00#post6605000
http://www.forexfactory.com/showthre...07#post6611207
http://www.forexfactory.com/showthre...74#post6611474
http://www.forexfactory.com/showthre...07#post6611507
http://www.forexfactory.com/showthre...15#post6611515
http://www.forexfactory.com/showthre...13#post6611913
21. Pattern "TMA M1 beyond TMA M5/M15" - trades and illustrations
http://www.forexfactory.com/showthre...62#post6604862
http://www.forexfactory.com/showthre...78#post6605078
http://www.forexfactory.com/showthre...46#post6598746
http://www.forexfactory.com/showthre...07#post6603607
http://www.forexfactory.com/showthre...90#post6603990
http://www.forexfactory.com/showthre...17#post6608417
http://www.forexfactory.com/showthre...86#post6608586
http://www.forexfactory.com/showthre...46#post6609046
http://www.forexfactory.com/showthre...96#post6609196
http://www.forexfactory.com/showthre...28#post6611228
http://www.forexfactory.com/showthre...50#post6611550
http://www.forexfactory.com/showthre...32#post6611932
http://www.forexfactory.com/showthre...31#post6612531
http://www.forexfactory.com/showthre...45#post6612645
DNA created a very nice PDF of this post, you can download it here:
http://www.forexfactory.com/showthre...43#post6610243
And there is an even better news! hollowhead created a PDF that contains all the examples and all the illustrations!
http://www.forexfactory.com/showthre...21#post6613121
Attached File(s)
Gentlemen always play by the rules. If they can't, they change the rules.
1