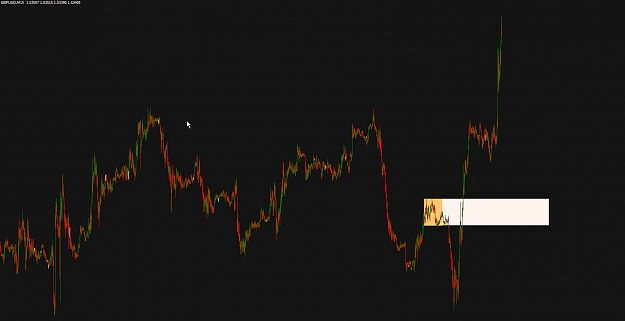
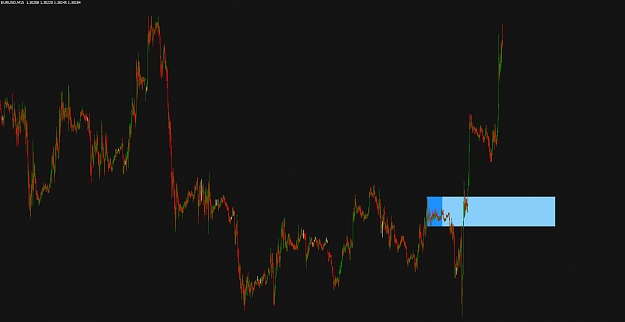
Disliked..when I switched back to the H1 chart to get a more clearly overview about what exactly happend, and switched back to my h4 chart again, the last loss just dissapeared and the indicator had opened another buy order which did hit the TP. As you can see on the screenshot, the H1 chart shows exactly what happend. Very weird. Anyone know why how this could have been happend? I don't use the EMA filter.Ignored
 Extracted Thread (per thread starter's request)
- #6,432
- Apr 6, 2013 5:41am Apr 6, 2013 5:41am
- | Commercial User | Joined May 2011 | 1,754 Posts
To improve is to change. To perfect, is to change often.
- #6,434
- Apr 6, 2013 5:53am Apr 6, 2013 5:53am
- | Commercial User | Joined May 2011 | 1,754 Posts
To improve is to change. To perfect, is to change often.
- #6,437
- Apr 6, 2013 6:31am Apr 6, 2013 6:31am
- | Commercial User | Joined May 2011 | 1,754 Posts
To improve is to change. To perfect, is to change often.
- #6,440
- Apr 6, 2013 6:48am Apr 6, 2013 6:48am
- | Commercial User | Joined May 2011 | 1,754 Posts
To improve is to change. To perfect, is to change often.