At the beginning of the use of Ichimoku it is not easy to understand how the
chinkou works.
With the Chinkou_Histo indicator ,that is easier:
-When the histo is red : Chinkou is bearish - Chinkou is below price.
-When the histo is yellow : Chinkou is bullish - Chinkou is above price.
Regards.
Ignored
Hi Sohocool,
Merci for your mt4 indicators.
Could you please create a histogram just as one above but with chikou above or below kumo. Hopefully this may be just a simple modification of your chikou indicator. I would be very grateful.
Thank you so much for the very fast response. I am truly grateful for your masterpiece indicators. Hope I can reciprocate in some way. For now, I wish you much good karma.
|
Joined Aug 2012
|
Status: Practicing to be perfect
|72 Posts
Hello Friends
Just researching around ichimoku for few days I found that it is one of most complicated indicator and I like japenese method of analysis and their tribute to the Technical analysis field I have been using candlestick patterns to trade and interested to add ichimoku over my tools to get better probability trades Only thing that bothers me is that the time period which will suit best for the ichimoku. I know that default is fine but in a market like spotfx what periods suits best for this indicator and why does that period suits best Please let me know your ideas
Thanks and Regards
Kingoffx
Gain or Lose there is always a winner named Market!!!
Just researching around ichimoku for few days I found that it is one of most complicated indicator and I like japenese method of analysis and their tribute to the Technical analysis field I have been using candlestick patterns to trade and interested to add ichimoku over my tools to get better probability trades Only thing that bothers me is that the time period which will suit best for the ichimoku. I know that default is fine but in a market like spotfx what periods suits best for this indicator and why does that period suits best...
Ignored
Due to the nature of Ichimoku any timeframe will work and on any instrument. Longer time frames is always better due to less whipsaw's etc.
Another bonus on longer time frames is you do not have to sit 24/7 infront of the PC.
D1: weak Bearish. The price below the cloud . however we have a weak buy signal When Tenkan Sen (in red) exceeds the Kijun Sen from the bottom up and the chinkou span above the past price. the next resistance will be tenkan sen at 1.31 and then the cloud 1.31.32
Attached Image (click to enlarge)
H4:Mix: we have a weak cross tenkan, kijun sell signal and the senkou span below the price. The price is inside the cloud now. So it need to break the cloud to go up more. The kijun sen is flat now so i think the price will be attract to it.
Attached Image (click to enlarge)
H1: weak bearish.
Conclusion: daily chart shows the bearish trend still exist. The strategy for today is wait for a strong signal at M5 to sell. or wait until price touch the resistance at 1.31 and reversal to sell.
I want to add my two pennies worth, Ive been trading ichimoku for about 3 years now and Im always testing new strategies on various small live accounts, but overall I like to keep my charts clean and simple. Im not a huge fan of indicators all over my chart, ichimoku gives me all I need and including my Take profit and Stop Loss..
Ill explain a little more on how I use ichimoku, but first I want to show you some analysis for Monday..
I too look for opportunities on the 4H while taking my profit targets from the Daily, I also take my entries from the smaller Time frames..
EURJPY
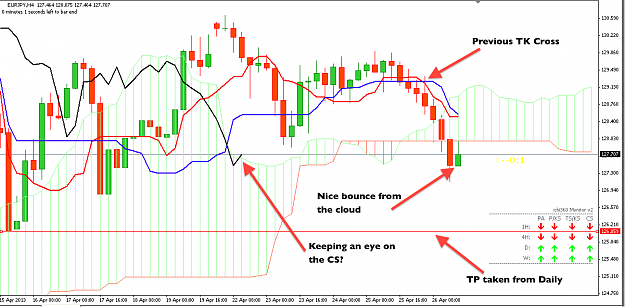
So first we have the 4H Chart
Attached Image (click to enlarge)
We had a weak Tenken Kijun Cross above the cloud as price moved into the cloud, this was the first good sign.
Next we had a breakout then a small retrace back towards the cloud, the current candle has bounced and producing a nice long wick, I will wait to see how this candle finishes, if it stays bearish then I will look to enter a SELL.
However if you notice the CS is either going to bounce within the cloud or break out, if it breaks above I will sit back, if we get a bearish bounce I will see this as further confirmation of the SELL.
Next I will look for a decent TP level so lets move up to the DAILY
Attached Image (click to enlarge)
The DAILY is showing us a possible break down below the TS, if this happens we could see price pull towards the flat Kijun Sen. (this is very much in line with what we see on the 4H) So I will want to place a TP between the break and the KS.
I see that the recent bounce of the the CS is a perfect TP so I will use this.
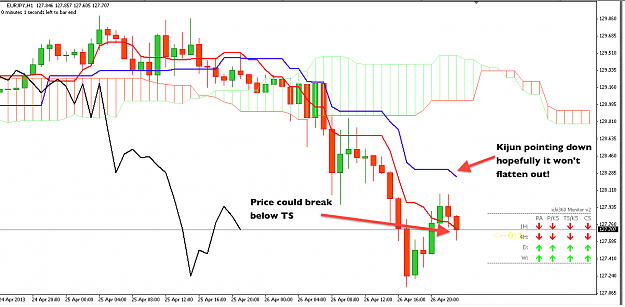
Lets have a quick look at the 1H
Again price is waiting to break below the TS and the KS in pointing down
Attached Image (click to enlarge)
All in all some strong Bearish action, lets see what plays out. I understand that its the weekend and we may miss the move on Monday, but I thought I would give you an idea on how I like to trade, I don't pay much attention to fibs and stuff, I like to set my levels within the ichimoku indicator like flat Kumo tops and bottoms and flat Kijuns etc...
I'm aware that there are histo indi's for when price is above/below Kumo but are there similar indi's for the other facets of Ichimoku, for example TK above/below KJ?
|
Joined Aug 2011
|
Status: conceive and believe to achieve
|342 Posts
hello everyone,
I saw this thread, and had to join!
currently long on usd/jpy and usd/chf. up about 50 and 60 pips on both respecitively. I use ichimoku cloud or kumo cloud along with the chiko span only. It helps me stay within the trend without having to exit on each cross of the tk/ks. I use the 1 hour to enter, and the 4 hour and daily to confirm the entry by making sure all three time frames are on the same page(bullish posture or bearish posture). Currently waiting on two daily time frames to confirm my long on USD/CAD and short on GBP/USD. Also to confirm my entry, the chiko span I almost forgot must be above the cloud for a long and below it for a short on all three time frames. When chiko span is within past price action, I usually hold my position only if current price doesn't touch the coud. If it does, I exit, and wait again for a break of kumo cloud. attached is screen shot of what I am waiting for on USD CAD.
Note Kumo cloud must also be bullish or green in order to enter this trade on the 1 hour. confirmation once again must be confirmed all three time frames.
if any of you use a similiar methods, please let me know!
happy trading
@ichi-mo-ku can you share that tiny ichi monitor as shown your chart? thanks
or anyone here care to upload same indicator as shown on ichi-mo-ku's post?
i trade H1 using fisher transform and instantaneous trendline. i used ichimoku mainly for trend guides, just utilizing cloud and chinkou span. it would help if i get an indicator that displays the D1 ichi activity, especially Chinkou vs cloud and chinkou vs price.
Hi ichi360,
I am very interested in Ichimoku system. I read page 438 and see a nice question from kinonen.
He discussed about 3 principles "times pane, wave and price target'. I am also researching about them but they are very difficult to understand and how to apply in the truth.
I saw your answer below (page 438). I think you are professional in Ichimoku. Could you explain clearly abuot 3 principle of Ichimoku?
Thank so much.
Kinonen, I've actually translated it myself by using Google Translator however what I've been doing is just translating the stuff on the fly while I'm reading it. However, if you notice there isnt much stuff really which needs to be translated as such, most of the secrets are actually hidden in the understanding of Charts itself ... This material is so far the only thing available about this particular topic which is the Ichimoku Time Reversals, not covered in any other book I've seen so far. Its extremely useful and thought provoking system and...
Guys we will be hosting a Live Ichimoku Webinar today on Thomson Reuters with Nicole Elliott "The Ichimoku Queen." Nicole was the first technical analyst who introduced the Ichimoku cloud system to a western audience and is the author of the book "Ichimoku Charts" She is the foremost expert on the system and provides valuable insights in how to use the system most effectively.
The webinar is entirely free to sign up, we will post the link to register shortly if anybody is interested