DislikedHi Favorite,
I haven't attached pictures before so this may not be right but will attempt.
If it shows up, here's what I see.
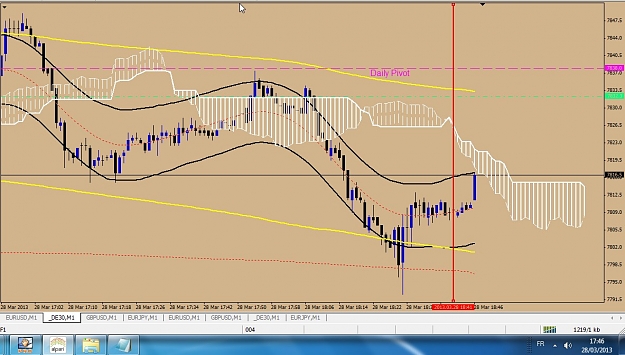
TMA 1(red) touches TMA 5(yellow) @ arrow about to re-enter TMA 5 zone. Trade entry is when the lines touch (red arrow). Stop is above the swing plus spread. Target (rectangle drawn) is near lower TMA 5 band. Target can be smaller since TMA 5 was sloped up so counter-trend trade. Notice also, MACD showed divergence so additional confidence to take the trade. Yellow drawn lines show divergence. When price is at an extreme (TMA...Ignored
Very good picture and a very good explanation, that's exactly what I thought after your previous post but I wanted to make sure that I got it right. Thanks again!
Gentlemen always play by the rules. If they can't, they change the rules.