Trademin,
Great post !!
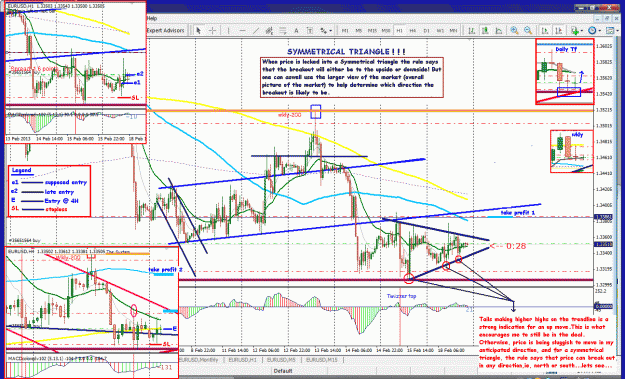
History repeated itself : EURUSD 2/12/2013 6am PST to 10 pm PST.
Question: What early indications do you look for to assess that the RT that is forming may be a fake one and would end up being a TC.
Regards,
snowfall
Ignored
here is my comments about it.- if any question, let me know,
POST FROM: FUIYONG
[quote=Fuiyong;6441989]Hi,
Thanks for sharing. I took at look at your analysis, and realised I might have not understood or confused about how to use the strategy correctly. I have many questions for you. Hope you don't mind taking them.
1. On the daily chart, the price was going to pull up to the 21ma but do we have to consider that there might not be much space for movement since the moving averages are also used as resistance?
2.On the 4hr chart, the MACD - is that continuous trend?
3. I cannot figure why you took the entry on the 1hr chart (10am). What is the indication?
4. And on the 4hr chart, the previous candle there was a long spike isn't that an indication price is not making the upward movement?
Thank you for taking my questions. And certainly hope you can be patience with me as I will have a lot of question.
Answers to Questions: I have taken your questions one after the other, and have made available answers unto you. I just copied the questions as you asked them in your post and have supplied you with answers accordingly.
Questions:
On the daily chart, the price was going to pull up to the 21ma but do we have to consider that there might not be much space for movement since the moving averages are also used as resistance?
Answer: The Daily Chart is a higher time frame chart, and even the smallest pip move in the Daily chart when traced to smaller time frame can give a lot of pips. That is why I consider the Daily; no matter how small the space might be so long as the anticipated move is within the rule- the price movement rule. That space you called a little space gave me up to 45 to 50 pips from the point of reverse. And that is what I took advantage of.
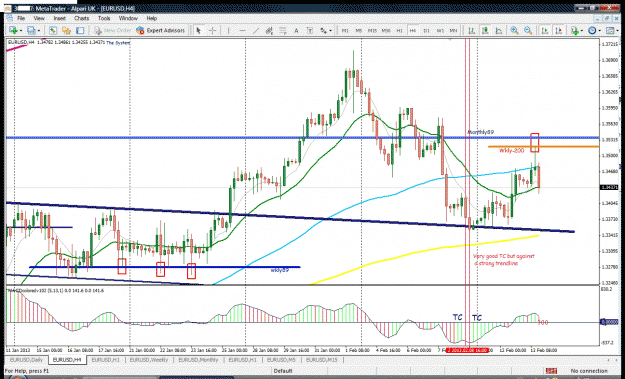
2. On the 4hr chart, the MACD - is that continuous trend?
Answer: I have posted the chart below to clarify on the question above. I did not show all the details in the previous post, but see more details below: The trend continuation seen in the MACD for the 4hr chart was against a trend line which is meant to serve as a support for price, so it is risky to enter the TC trade at that level. You have to know that when a very good signal or candle appears in the wrong place in the market, it is very likely that it will not give the expected result. So the TC was very good for a move down, but not well situated,(the move supposed move down was against a trend line) and as you can see it did not workout to the down side, but the trend line successfully reversed the movement.
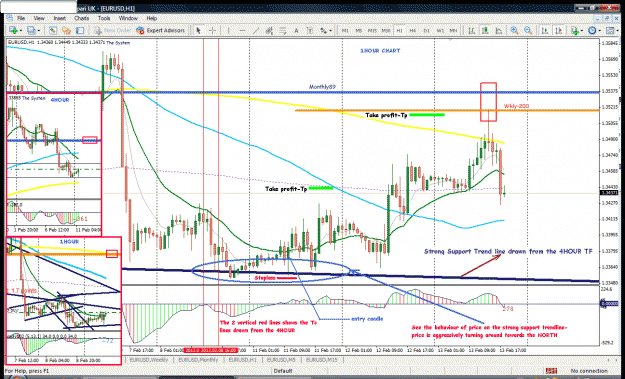
3. I cannot figure why you took the entry on the 1hr chart (10am). What is the indication?
Answer:
I just put the time 10:00am because this system is a 4hr system and trades can be taken at the 1hr time frame to be into the 4hr candle early enough, as such when I see a good set up in the 1hr that agrees with my anticipation in the 4hr, I do not wait for the 4hr candle to close. Rather I switch to the 1hr execute my deal, and before the 4hr would close, I am already in to good pips. So 10:00am reminds me that I am close to the close of the 4hr candle(12:00) and if I see good opportunity, I can enter ahead of time to enhance my profits.
I took the entry at the 1hr because of the aggressive behaviour of price at that stage. I did mention it in my previou post. At the 1hr chart, the move down has been hindered, the market is finding a hard time to procceed to the south. And this is because of that trendline I have mentioned above which served as a support for price.
4. And on the 4hr chart, the previous candle there was a long spike isn't that an indication price is not making the upward movement?
Answer: You are right! But you have to understand what I said earlier: the spike was to support the move down, just as the TC on the MACD-YES! But the support trend line said NO! So in this whole system or strategy of trading, a lot of things have to be considered for one to make a successful trade. Remember that it is a game of probability, which means that as price moves in the market there there are barriers to its moves(support and resistance every where), and when these barriers have more strength or potential than the force or strength of price or the market itself, they are able to hinder its move, the move of price and vice versa! Hence the formula below:
Probability, P = Sample space /Sample size
Summary: So at that stage, due to that support trend line(SEE CHART). It is recommended to wait to see how price plays out or fights its way through the support line or the barrier, and from the chart after few candles, price declared its weakness showing that it can not make it to the south, and it reversed giving us a nice entry to the long or north direction and I was in that deal which gave a move of 123 positive pips.
So when you spot a good signal, do not rush to pull your trigger, but ask yourself it there is any thing (barriers like-moving averages, trend lines, big nos, pivot level, Fibonacci, etc) that will actually contend with or fight the direction you are about to take with your trade or execution. Consider also the overall weather of the market, consider higher time frames, etc. Having done all these and you see that the road is clear, then you can execute your trade.
May God grant you the insight to understand these posts!
SEE THE FOLLOWING CHARTS BELOW FOR DETAILS. THE CHART BELOW AND THE ONE ON PAGE 1688, POST NO.25306
Do I remember correctly of a video or article by the author of the use of the moving averages ... 8, 21, 89, 200 etc. I can't seem to find that video or article. Can someone tell me in which folder it is. I need to revise what the moving averages are for. thanks
This is my first post here. I have just discovered Phillip Nel system. In the PDF I have it states the inputs for the MACD as 5,13,1.
Did he later change those settings to 10,22,1?
Regards
Ignored
welcome in this tread,
thanks for asking me,
Phillip Nel used the 10,22,1 for the daily -he adds also rsi set at 8-( in his weekly Anticipation) but the battle field is on the 4hr chart since it is called 4hrs Macd Strategy.
-for the 4 hrs go with 5,13,1---this is what settings are.
- I personally use 5,13,1 on any time frame. only once in a while I use 10,22,1
the system is based on the 4hrs tf, sure will give a better view of supports and resistance, and trend by looking at daily,weekly,montly...
it's like moving away from the tree in order to see the forest's fences and paths and then going back to the tree and now having a better idea where you stand and what could be done from here.-
have a nice reading in this tread, and again, many thanks to Phillip Nel ,
I tried to learn this system 2 years ago when i first started learning about trading forex, but it was too complicated for me as a complete beginner.
I also did the newbie thing and went straight to the 1 min and 5 min charts as I thought i could not wait for the 4 hour candles., but they are still there after 2 years.
So after 2 years I found myself back on this thread and re-reading the system and understanding it more now.
naustingfx your posts are informative thanks for taking the time to post.
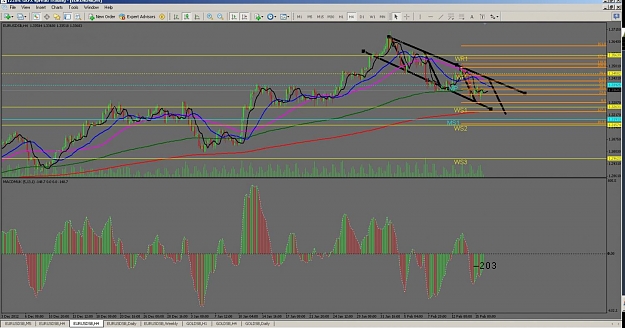
Attached is my analysis for Monday 18th...
My idea is that the MACD will hit the zero break and price will break down once it hits my top trend line and 61.8% fib from last swing.
Price should hit the 3 moving averages in this area too.
EURUSD
on the weekly there is a move down tending to the 89sma.
on the daily: there is a SHS going on, price now sitting right at the breakout level, but there is a weakness shown on the right shoulder, a clear negative divergence appears on the macd. (between the shoulders and the macd)
on the 4hrs chart: couples of TCs have been witnessing a possibility of a down move.
I have been short, still is.-my target still 1.3200 will see...
Hi,
Thanks for sharing. But I don't see the MACD formed on the 4hour chart? Although the weekly and daily show downtrend.
Do you see any potential for GBPUSD that is downtrending. I wonder how i could trade this pair. I seem not to have much success with this pair.
Nic
EURUSD
on the weekly there is a move down tending to the 89sma.
on the daily: there is a SHS going on, price now sitting right at the breakout level, but there is a weakness shown on the right shoulder, a clear negative divergence appears on the macd. (between the shoulders and the macd)
on the 4hrs chart: couples of TCs have been witnessing a possibility of a down move.
I have been short, still is.-my target still 1.3200 will see...
I tried to learn this system 2 years ago when i first started learning about trading forex, but it was too complicated for me as a complete beginner.
I also did the newbie thing and went straight to the 1 min and 5 min charts as I thought i could not wait for the 4 hour candles., but they are still there after 2 years.
So after 2 years I found myself back on this thread and re-reading the system and understanding it more now.
naustingfx your posts are informative thanks for taking the time to post.
Attached is my...
Ignored
Hi and how are you?
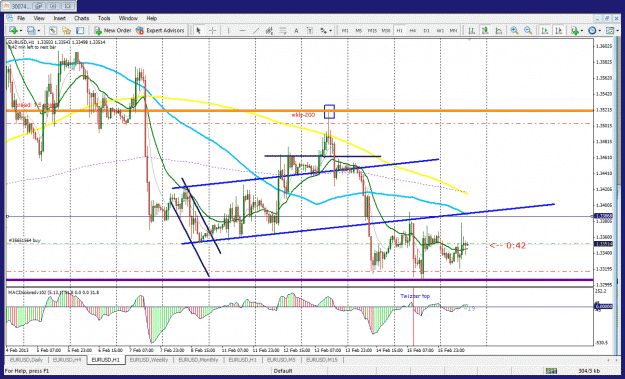
You are welcome back to the system. Please bear with me I did not really come to the forum during weekend. But I have done my analysis in my heart on how today will be, the different behaviour the market is most likely to show today. But if you promise me you will be here always on weekends, then I can try to do my analysis on what I will be expecting the market to do in the trading week ahead and post it here in the forum for you to see. At certain times I do post my analysis and they have all been effective. BUT TAKE A LOOK AT WHAT I HAVE DONE BELOW: I HAVE EXECUTED A TRADE FOR TODAY-18th February 2013. I was not around early enough, but I took it. IT IS A LATE ENTRY TRADE. HOPEFULLY I CAN MAKE SOME PIPS ON IT. BUT WHAT I HAVE DONE IS THAT I HAVE REDUCED MY STOPLOSS TO VERY SMALL SIZE SINCE IT IS A LATE ENTRY TRADE. I TRY TO BE VERY CONSERVATIVE.
Here is a position I took with respect to my analysis on the Eur/Usd pair. It is a late entry trade, I could not come up live on time. I am about 13pips late now. I have missed the first 40pips move from the close of that pin bar or tail below which I have put my stoploss for my current position. So I have reduced my lot size very much to make up for my coming late, this is a penalty I take upon myself to discipline myself in this business. I hope it works out as set out.
SEE THE CHART FOR MORE INFO. It is a trade I took from the 1HOUR chart as seen below but in support of the 4HOUR Market Rhythm. I may post the updates later. Enjoy! And comments are welcomed!
I certainly did not see this coming. On the 1hr chart, the MACD is so messy and where is the entry, stop loss and target. I don't understand your chart. I am slow and a young trader. Appreciate you explain this for me. Thank you.
Quoting naustingfx;6453969[CENTER
Disliked
18th February,2013
EUR/USD TRADE GMT+2
Here is a position I took with respect to my analysis on the Eur/Usd pair. It is a late entry trade, I could not come up live on time. I am about 13pips late now. I have missed the first 40pips move from the close of that pin bar or tail below which I have put my stoploss for my current position. So I have reduced my lot size very much to make up for my coming late, this is a penalty I take upon myself to discipline myself in this business. I hope it works out as set out.
SEE THE CHART FOR MORE INFO. It is a trade I took from the 1HOUR chart as seen below but in support of the 4HOUR Market Rhythm. I may post the updates later. Enjoy! And comments are welcomed!
I am new in trade market, I try to learn this strategy but my poor english its the dificult, because I only speak spanish. I hope to learn it to have best trades like you.
bye.
Update of events in the market. Thanks brothers for you comments.
SEE MY CHART BELOW AND SEE IF YOU CAN FIND SOMETHING USEFUL.
I tried to answer the questions asked and as well to make things more clear. Enjoy!!!
I did this analysis before reading your post. I understand your analysis. I did not see the triangle pattern and probably not sure how to apply it anyway. But you have explained well.
I took the trade at around 1300hr. I set the target at 21ma (I thought I would be happy to take a 20 odd pips profit) because it was late and I thought if i could take the 20+ pips profit and go to sleep. But it went over night and am now running at a marginal loss. I went in on the 4hr MACD analysis. I did not pay much attention to the 1hr, daily and weekly chart.
Update of events in the market. Thanks brothers for you comments.
SEE MY CHART BELOW AND SEE IF YOU CAN FIND SOMETHING USEFUL.
I tried to answer the questions asked and as well to make things more clear. Enjoy!!!
Hi,
Thanks for sharing. But I don't see the MACD formed on the 4hour chart? Although the weekly and daily show downtrend.
Do you see any potential for GBPUSD that is downtrending. I wonder how i could trade this pair. I seem not to have much success with this pair.
Nic
Ignored
hi nic73, sorry for being late to answer you,
I agree with you, I wouldn't either having great success with GBPUSD. When you say that you do not see the macd formed on the 4hr chart, do you mean that you don't see the TC?- sure there is a divergence on the macd, a possibility of a pull back there, but there are TC there, if this is what you meant by "formed".
I stick to EURUSD pair since I found GBPUSD as not as easy seeing the picture in GBPUSD.-
GBPUSD has been in consolidation for quite some years! Look at the weekly chart :I see too much moving averages becoming entangled. On the daily, occasions for a trade are for very patient peoples.-so what is left for the 4hrs chart are occasional (my view) very nice ride just like this last ride down which is almost at the bottom, if it is not there already.- This was a rapid look at the GBPUSD since I do not trade on it.
I FIND EURUSD chart delivering more nice formations, some beautiful SHS, some nice pull back to break out, easier to grab trades opportunities in this pair, that's my opinion.- I suggest to new people in this tread to start with EURUSD, get familiarize with it, then later you can try other pairs.- I personally do not want to go with others pairs at the moment.
hi nic73, sorry for being late to answer you,
I agree with you, I wouldn't either having great success with GBPUSD. When you say that you do not see the macd formed on the 4hr chart, do you mean that you don't see the TC?- sure there is a divergence on the macd, a possibility of a pull back there, but there are TC there, if this is what you meant by "formed".
I stick to EURUSD pair since I found GBPUSD as not as easy seeing the picture in GBPUSD.-
GBPUSD has been in consolidation for quite some years! Look at the weekly chart :I see too much...