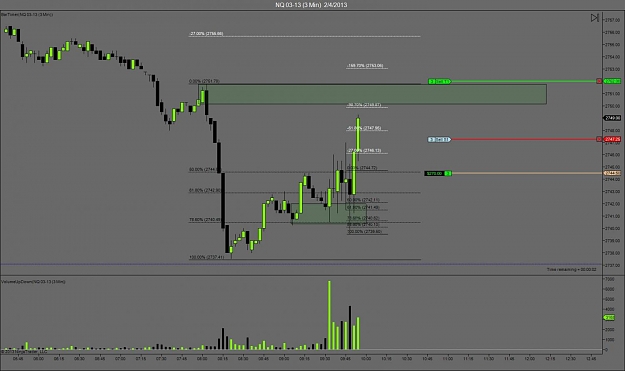
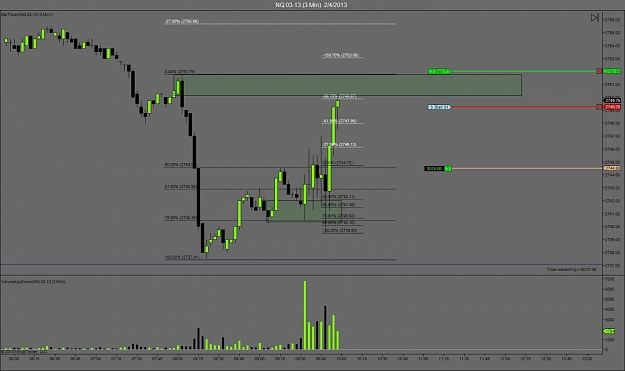
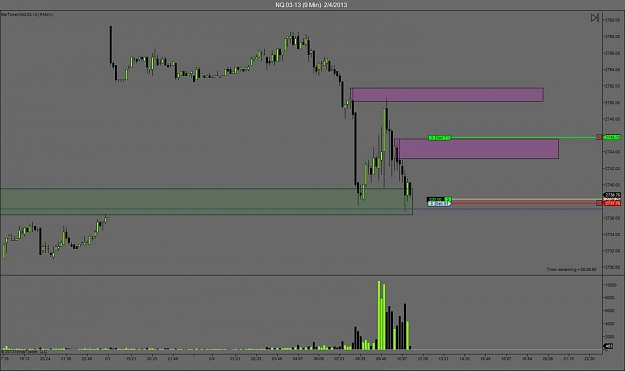
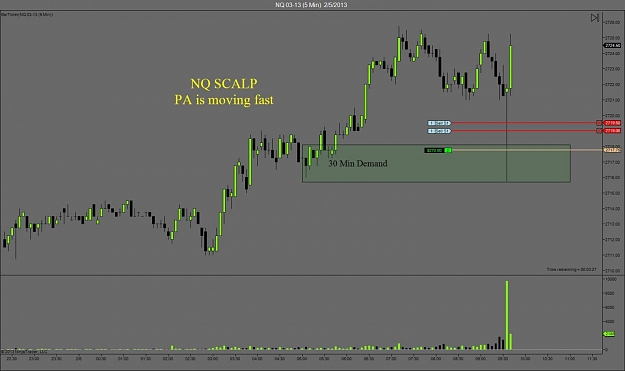
Notice all the Long wicks on both long and short candles. There was a battle between the Bulls and the Bears. This was a very difficult market today. Normally I would stay away from this type of market and look for another pair to trade. My profit for the NQ today was only $95.00, Rocky...
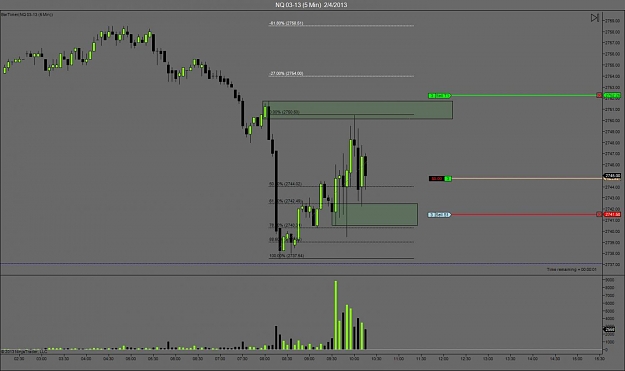
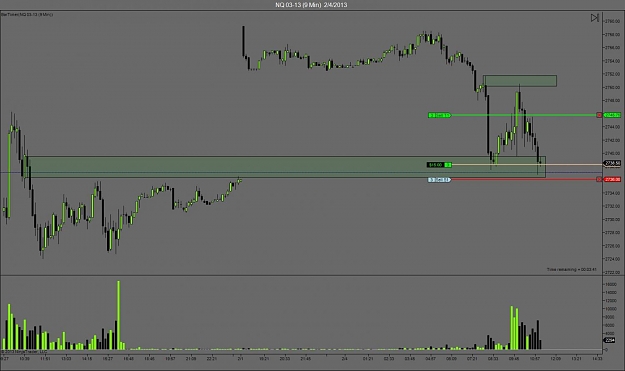
You've taken supply @2750.50 from the 3 min chart but have switched to 9 min chart, could you please explain why?
Thanks
Ignored
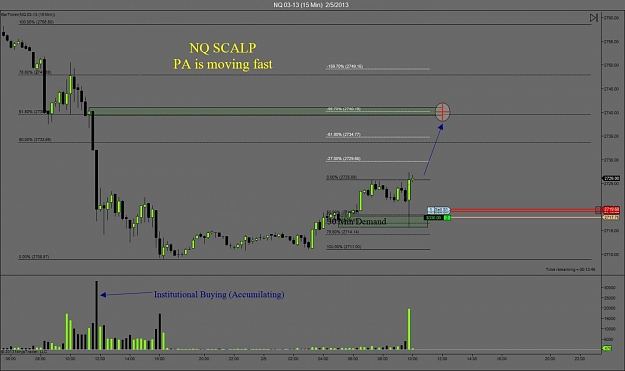
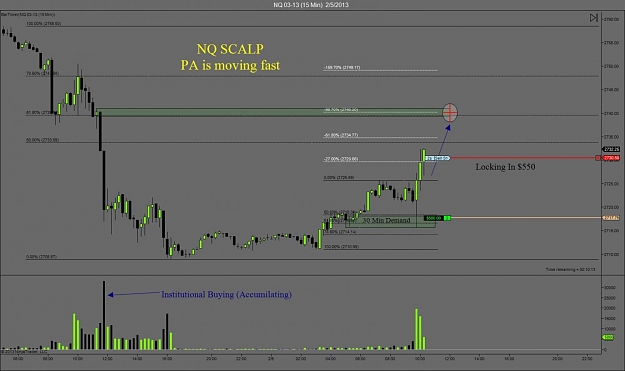
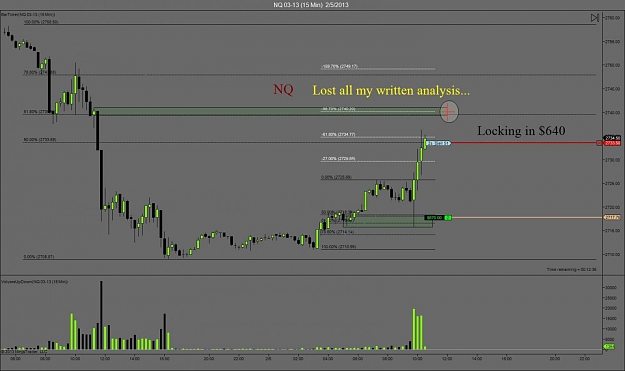
I'm constantly switching lower time frames looking for an inbalance of Supply and Demand. To simply put it, I'm looking for VSA setups. It's all about uncovering the Intent of the Institutions at or near Supply and Demand. Today was a very choppy day to trade most pairs and I was having difficulty locating good VSA setups. If you start to see long wicks on both Bull/Bear candles then that should tell you to stay out of the market. Don't look into todays charts too much because they are not good examples to learn from, Rocky...
I'm constantly switching lower time frames looking for an inbalance of Supply and Demand. To simply put it, I'm looking for VSA setups. It's all about uncovering the Intent of the Institutions at or near Supply and Demand. Today was a very choppy day to trade most pairs and I was having difficulty locating good VSA setups. If you start to see long wicks on both Bull/Bear
[color=blue]candles then that should tell you to stay out of the market. Don't look into todays...
Ignored
Whoops one more thing .. the standard charts setting include a 10 minute chart, would that not have served the purpose the 9 minute chart did, I suppose this is what I found intriguing?
I'm constantly switching lower time frames looking for an inbalance of Supply and Demand. To simply put it, I'm looking for VSA setups. It's all about uncovering the Intent of the Institutions at or near Supply and Demand. Today was a very choppy day to trade most pairs and I was having difficulty locating good VSA setups. If you start to see long wicks on both Bull/Bear
[color=blue]candles then that should tell you to stay out of the market. Don't look into todays...
Ignored
Agree.. Today's charts are good examples what we should stay away from. I would submitt here is an educational opportunity
To someone learning this method and trying to see inside the price " what the institutions are doing or not doing ??? " long wicks on Bull/Bear candles then that should tell you to stay out of the market. "
Knowing this helps us stay out when price is not acting right. You have to recognize it, to determine it. I like to see the wicks long and up for shorts...long and down for longs.. I agree with Rocky on lower TF to see inside price..But it does not hurt to just take a peak at a higher TF as the SM's will operate in all TF's. A good example would be when price is approaching the H1 TF.. Taking a quick peak once the TF closes sometimes will yield that candle that helps you see that clear rejection...
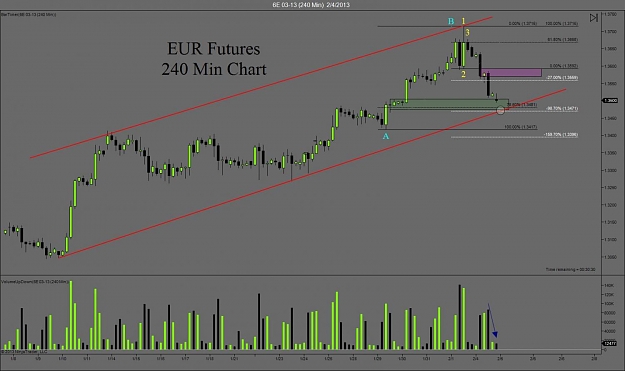
Hi Rocky, I had your same setup on EUR, and price was rejected nicely.
I have a question about no demand/no supply patterns in H4 (M240) charts, like the one you showed in your previous post about EUR.
If you draw a H4 chart of any instrument, everyday you'll see 3 high volume bars (EU+US session) and 3 low volume bars (Australian/asian session). An exception can be AUD, JPY, NZD, for obvious reasons, but any other currency/commodity behaves like this.
That's why I was always going to a lower timeframe to find VSA patterns, because in my opinion H4 chart is devising: it doesn't show the smart money behaviour, but just a normal oscillation in volume due to the different number of actors in the market; afterall, CME market is based in the USA.
I'm sure you weighted this thing; do you somehow interpret the low volume bars during the night, comparing them to other nights, or just use them like for any other timeframe, comparing them to the recent bars, independently from bar time?
Hi Rocky, I had your same setup on EUR, and price was rejected nicely.
I have a question about no demand/no supply patterns in H4 (M240) charts, like the one you showed in your previous post about EUR.
If you draw a H4 chart of any instrument, everyday you'll see 3 high volume bars (EU+US session) and 3 low volume bars (Australian/asian session). An exception can be AUD, JPY, NZD, for obvious reasons, but any other currency/commodity behaves like this.
That's why I was always going to a lower timeframe to find VSA patterns, because in my opinion...
Ignored
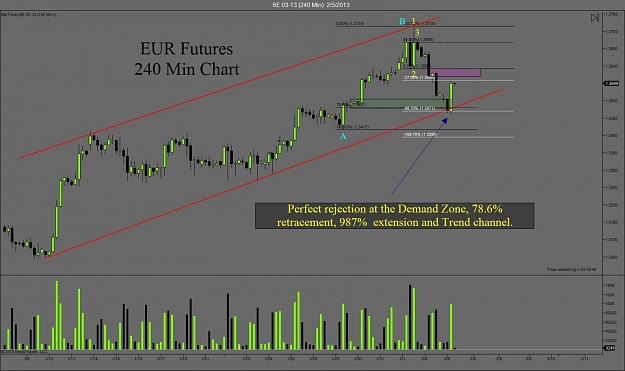
This is something that I have analyzed many times through out the years. The most reliable times to trade VSA is the U.S. session. Dropping down to a lower time frame from a 4 hr chart will give you a better picture of Institutional Intent. But I have found through my years of trading the 4 hr chart is if I did have a VSA setup with a strong Analysis at the close of the 10 pm EST candle I could still place a trade with a high degree of success. Now is this because of my VSA analysis or PA touching a zone we really will never know for sure.
There are other Institutions around the world that trade Futures during these times and seeing low volume does not always mean non Institutional involvement. Low volume could be a fail test by the Institutions of a "No supply" or 'No Demand" VSA setup. But to the retail trader this would appear as if the Institutions are not active, Rocky...