(Forgive the formatting of picture etc, just getting used to Ninja..)
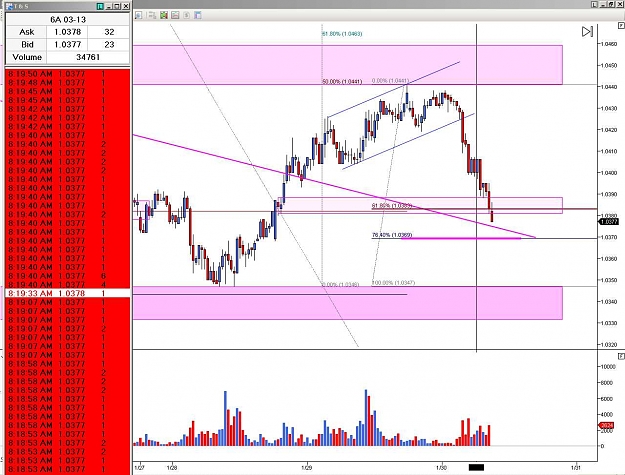
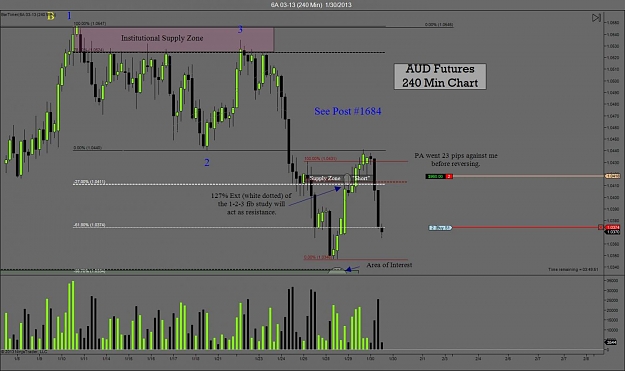
I'm focused on the two High Volume bars just before the one you highlighted, these seem to imply that institutional buying ALSO started at approx 1.0470, would that be correct? Which implies that the institutions are still holding positions from there, as they head towards the lower demand zone you mentioned in your last post approx 1.0320 - 1.0340?
(Forgive the formatting of picture etc, just getting used to Ninja..)
I'm focused on the two High Volume bars just before the one you highlighted, these seem to imply that institutional buying started at approx 1.0470, would that be correct?
Regards,
Ignored
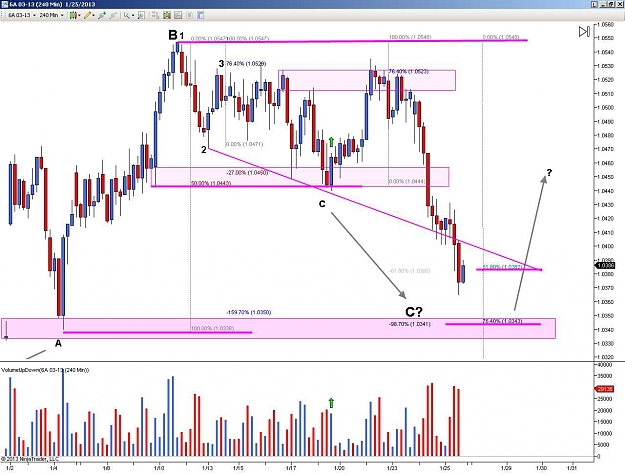
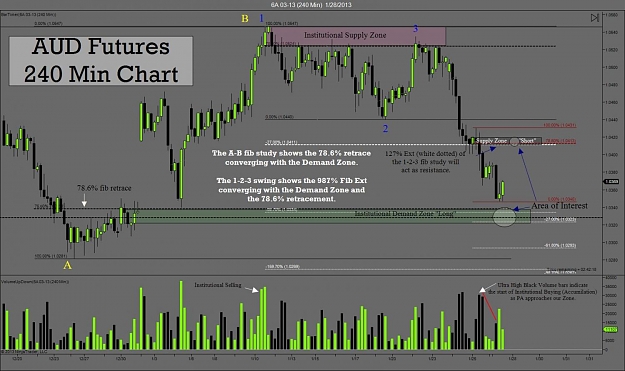
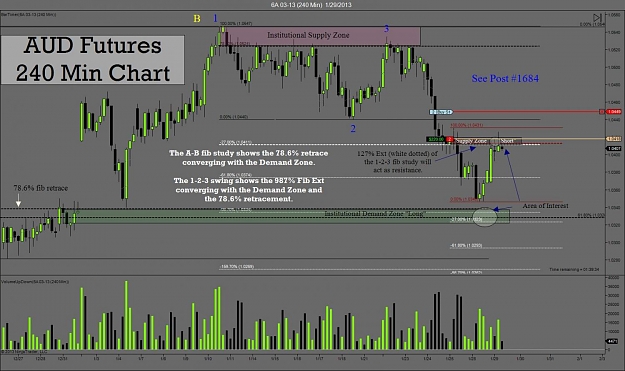
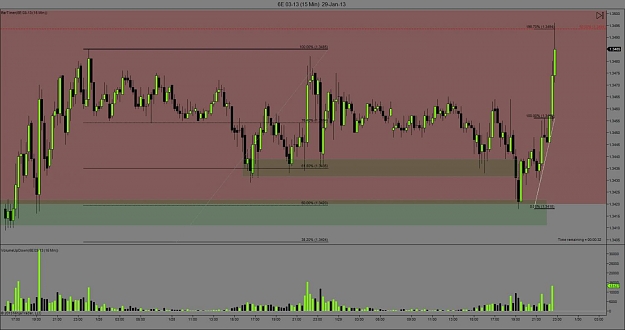
4xfactor, good question. VSA is something that takes time to learn. Usually the ultra high volume bars indicate Institutional activety. Knowing when it's Institutional buying (accumilation) is fairly easy to spot. The 1400 hr candle EST (1.0374 close, Futures Market), would be what I consider the start of the accumilation phase. Why, it's in close proximity to a Demand Zone and there's a herd mentality to "short" the market.
If you have studied Supply/Demand then you know that there are some Institutional orders waiting at these zones. But because of the vast amount of contracts that Institutions need to acquire in order to move and "trick" the market, they don't wait to start buying when it touches our zones, they need to add to those contracts slowly before entering the zone as to not telegragh their intent. They will actually start buying (accumilating) in vast quantities when the herd is selling as PA is moving right down into a Demand Zone. This is all done under the radar and hard to spot unless you understand VSA.
Institutions are there to transfer your account into theirs and they can't do that if they lay all their cards out all at once on the table at a Demand Zone. They have to ease into their position in increments. They buy at wholesale and sell at retail. So look for these Ultra high volume bars/candle when PA is moving up or down into a zone, Hope this helps, Rocky...
4xfactor, good question. VSA is something that takes time to learn. Usually the ultra high volume bars indicate Institutional activety. Knowing when it's Institutional buying (accumilation) is fairly easy to spot. The 1400 hr candle EST (1.0374 close, Futures Market), would be what I consider the start of the accumilation phase. Why, it's in close proximity to a Demand Zone and there's a herd mentality to "short" the market.
[color=blue]If you have studied Supply/Demand then you know that there are some...
Ignored
My interpretation: institutions probably start a a down move themselves, removing their buy orders to make the move easier and selling some contracts at market to "mark down" the price. Through this test, they can see if there is no interest for lower prices (no supply), and in this case we'll see a small bar with low volume; or if the herd follows, and in this case they will buy lower, causing a large bar with high volume. If this is the case, stop losses of who is long will help their cause. Generally this happens after bad news.
All this doesn't always mean that the market is ready for an inversion after the large down bar; first because there's more than one institution, and they might behave differently; second because institutions may start to accumulate for a larger move, maybe they have in mind the next 6 months, not the next 6 hours: they can afford to keep losing positions for a long time. Or maybe they're just covering their short positions, we don't know.
What we know, or better, what rocky showed us in all these months, is that when this happens close to a demand zone, there's a very high probability, depending on the context (FIBs, trendlines, VSA patterns) that we'll see a rebound which can be exploited to make some cash.
What I mean is that we probably can't understand but maybe 1-2% of what institutions do, but also that this 1-2% is sufficient to spot small trading opportunities which can allow an individual to make nice profits out of a relatively small bankroll.
My interpretation: institutions probably start a a down move themselves, removing their buy orders to make the move easier and selling some contracts at market to "mark down" the price. Through this test, they can see if there is no interest for lower prices (no supply), and in this case we'll see a small bar with low volume; or if the herd follows, and in this case they will buy lower, causing a large bar with high volume. If this is the case, stop losses of who is long will help their cause. Generally this happens after bad news.
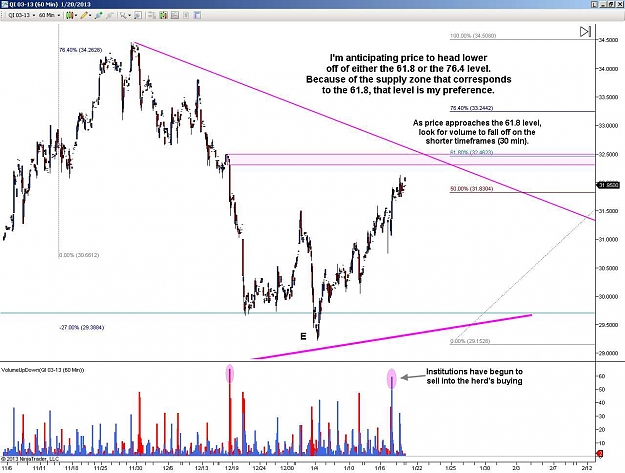
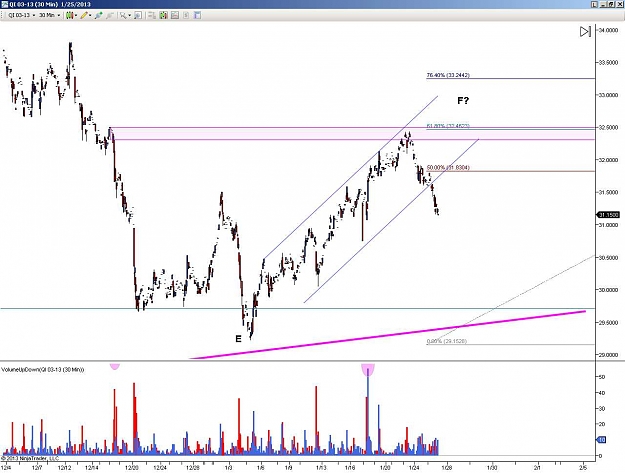
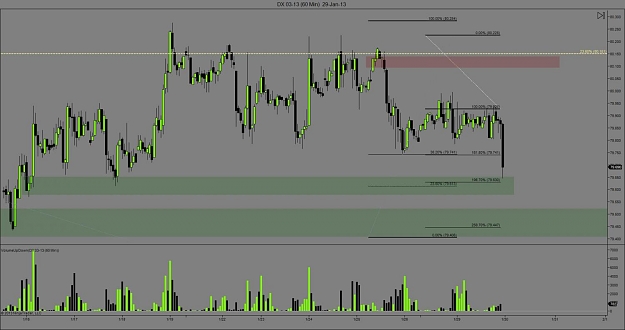
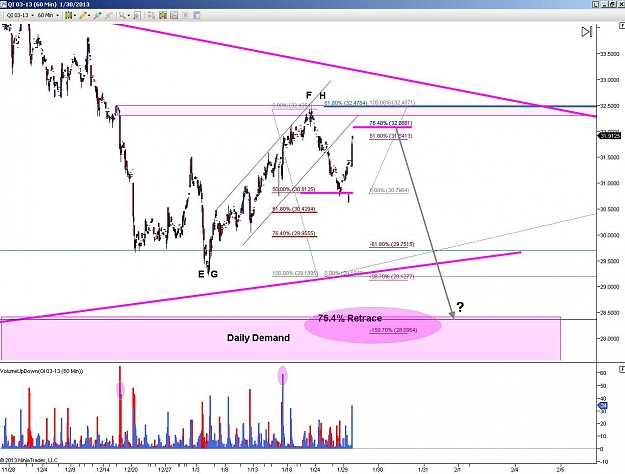
Here's the 60 min chart of Silver. Price action has entered into retrace levels. Assuming volume cooperates, my assumption is for a move lower into the daily demand level below. This corresponds to the 76.4% retrace from the A,B swing, the 161.8% ext from the 1,2,3 move and the 159.7% ext on the current retrace.
I want to once again thank you for taking the time throughout the history of this thread to help teach us how to trade!
I know personally, your insights have made a big difference in my ability to spot opportunities!
I apologize for posting so many charts. This is your thread....not mine, so if this is an irritant for you I will refrain from doing so in the future!
Ignored
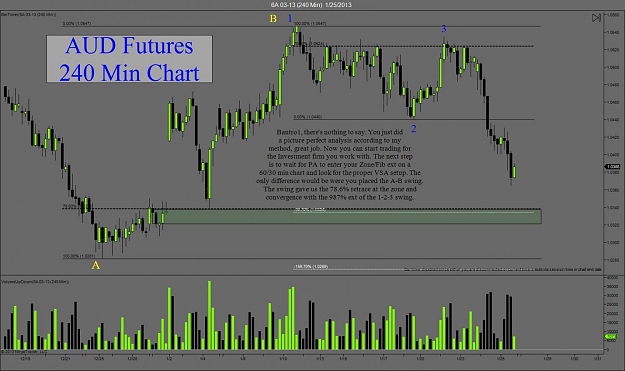
Bantro1, post all you want, we are here to learn. Unfortunately I can't respond all the time but that should not keep you from posting charts. Rocky...
My interpretation: institutions probably start a a down move themselves, removing their buy orders to make the move easier and selling some contracts at market to "mark down" the price. Through this test, they can see if there is no interest for lower prices (no supply), and in this case we'll see a small bar with low volume; or if the herd follows, and in this case they will buy lower, causing a large bar with high volume. If this is the case, stop losses of who is long will help their cause. Generally this happens after bad news.
All this...
Ignored
Well done
I have a, shall we say, a lingering question? You statement “we probablycan't understand but maybe 1-2% of what institutions do “brought it tomind again.
With as much information that is available today (it’s really difficult foranyone to keep something secret days) I'm surprised we do not have more informationon how the SM's do what they do. Excluding ALGO's (way too complicated for me) Proprietaryprograms, etc... I surprised more have not come out and spilled the beans.
There's the one school of thought that says they have been trading verysimply this way for years. What makes them so formidable is they have VERY DEEPPOCKETS and can take much larger positions hence allowing the buy into declinesand sell into rallies. To do this and to move price as they obviously do, isdoes take very deep pockets.
I subscribe to this as it just makes sense. Given the (SM's) have to make aprofit, they make the market, they must move inventory, they cannot or try notto show their hand as you stated. I also believe that they capitalize (very effectively) onthe fear and greed as this allows them to move their inventories veryeffectively. It is a very efficient way to make large amounts of money.
One idea that intrigues me: There must be different levels of very largeactivity as there is more than one larger player. The total amount of retailtraders (I would think) is not enough to handle the entire inventory thatmultiple large institutions would be trading at any one given time. If that isthe case there must be trading happening between (trading against) other largerHedge funds, Central Banks and other large institutional players? They alldon't have the same trading plan. There are similarities.... more than thedifferences I would bet...but maybe I'm wrong? This creates the question: Thereare winners and losers in institutional arena... here is a link that highlightssome of them. Disclaimer> I do not attest for the accuracy of the list andonly site as a possible example. http://en.wikipedia.org/wiki/List_of_trading_losses (http://en.wikipedia.org/wiki/List_of_trading_losses).. This leads me to the statememt earlier: They all do not trade the same way. So there is competing forces even at the larger level ( much like the SM and Dumb money ). To me this raises some interesting questions..Too many to go into now.
The one thing I do know is, that which we do S/D, works. our ability to see/read.. our tools are simple yet powerful. Their size, and the sizeof their moves, gives them away. They have to take the other side in order tomake a profit (move inventory). Our advantage is that we see it (like the Bullin the China Shop... Even though he may have slippers on) he will still makesome noise.
I have a, shall we say, a lingering question? You statement “we probablycan't understand but maybe 1-2% of what institutions do “brought it tomind again.
With as much information that is available today (it’s really difficult foranyone to keep something secret days) I'm surprised we do not have more informationon how the SM's do what they do. Excluding ALGO's (way too complicated for me) Proprietaryprograms, etc... I surprised more have not come out and spilled...
I have a, shall we say, a lingering question? You statement “we probablycan't understand but maybe 1-2% of what institutions do “brought it tomind again.
[size=3][font=Times New Roman]With as much information that is available today (it’s really difficult foranyone to keep something secret days) I'm surprised we do not have more informationon how the SM's do what they do. Excluding ALGO's (way too complicated...
Ignored
TSD, very well said. You have a way with words"Our advantage is that we see it (like the Bullin the China Shop... Even though he may have slippers on) he will still makesome noise".I had to call one of my trading buddies in NYC and repeat your remark about having slippers on, we both got a laugh out of that...Very funny and well said, Rocky...