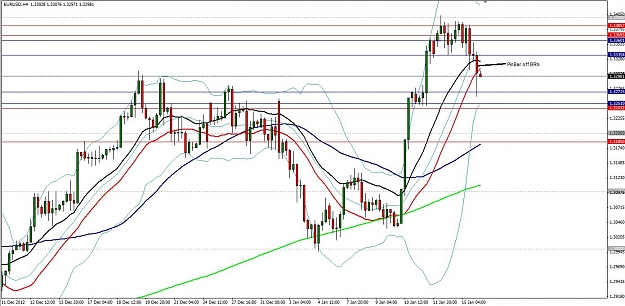
Be careful here, remember a pinbar must open AND close within the previous bar. THis is actually looking weak rather then strong because of that reason
Ok, actually I did not know that! When I first considered this trade my first target was the swing lows at 1.3248 . Then I thought, price is going to react at 1.300. Now that you have explained the pin bar rule my 1.3248 target might get attention. Thank you for helping!!!!
Ignored
yes this is exactly how we use bars to further help manage trades as well. It's sitting on a previous resistance but the bounce was not very strong to think this support is holding that well
Hehe, just i learned this technique from you
I already closed this one by the way. Right on that strong down bar close. It's my exit technique under development
yeh i was talking about the daily time frame but i obviously misunderstood some stuff about jarroo's method. that explains what i need to look for in terms of LCS and HCR. still very keen to get into the PF so i can learn more about how it works.
thanks for your help.
obviously price did not break through that level so my supposed signal was not right. oh well live and learn.
thanks again for your help
hally
Ignored
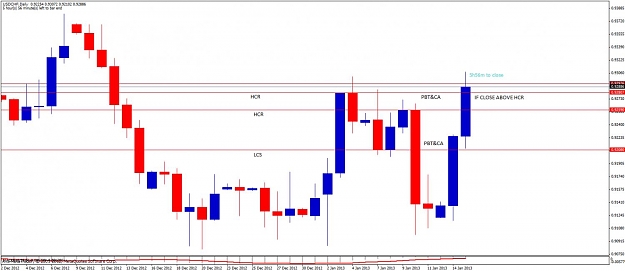
Here are a couple of charts.
Remember, we are not looking for a HCR or LCS on the current swing, we are looking for a previous Swing Point.
Hope they help.
I know it can sound very confusing at first.
Set your CHF/JPY chart up with the same levels and watch what happens at this level.
Try and find a Monthly & Weekly Level that are the same level or, a Weekly & Daily level.
Ignored
thanks pinbar i'll have a look at these later on (at work atm).
i have been looking at the current swing which is obviously where i was confused. i'll have a look back through my charts at previous swing highs/lows. might start with the higher timeframes (weekly/monthly) and work my way down to daily timeframes.
was watching a video in the guest area of the PF the other day and james said that you need to be able to trade sideways markets in order to be consistently successful so i'm really looking at jarroo's method as a way to identify consolidation zones (PPZ's i guess) and then trade them according to the price signals.
plan to join the PF by the end of the week so i think that might be a steep upward learning curve.
thanks pinbar i'll have a look at these later on (at work atm).
i have been looking at the current swing which is obviously where i was confused. i'll have a look back through my charts at previous swing highs/lows. might start with the higher timeframes (weekly/monthly) and work my way down to daily timeframes.
was watching a video in the guest area of the PF the other day and james said that you need to be able to trade sideways markets in order to be consistently successful so i'm really looking at jarroo's method as a way to identify consolidation...
Ignored
Good job, in a month you can teach me stuff.
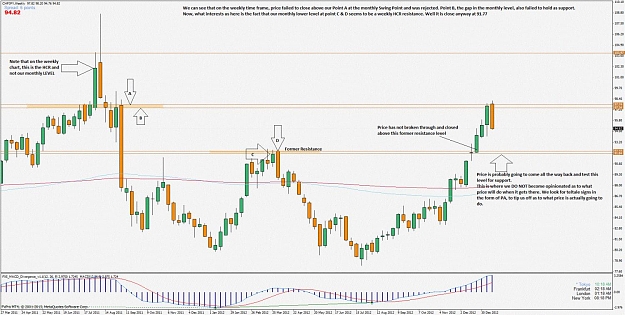
Weekly levels that are also a daily level is a good start, just check the monthly levels to make sure you are not trading straight into one, the wrong direction.
Weekly levels that are also a daily level is a good start, just check the monthly levels to make sure you are not trading straight into one, the wrong direction.
Remember, we are not looking for a HCR or LCS on the current swing, we are looking for a previous Swing Point.
Hope they help.
I know it can sound very confusing at first.
Set your CHF/JPY chart up with the same levels and watch what happens at this level.
Try and find a Monthly & Weekly Level that are the same level or, a Weekly & Daily level.
Ignored
thanks for the charts pinbar. that gives me a much better idea as to how to find the HCR and LCS zones/levels.
having a look through some charts now to see what i can find and then i'll see if i can post some really silly questions. lol
Hi, my first post here, even though I follow this thread for quite some time... Thank you for all the effort you invest in this...
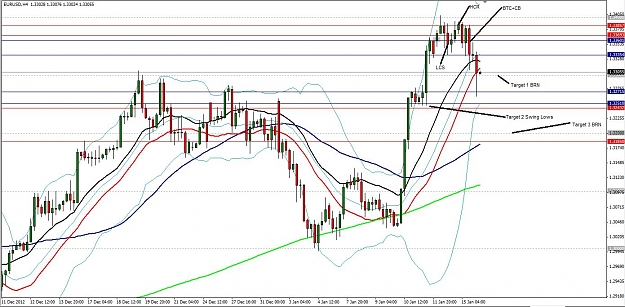
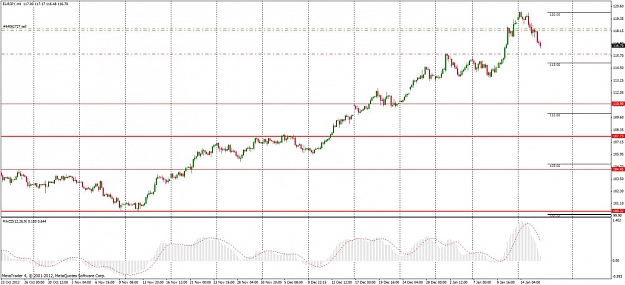
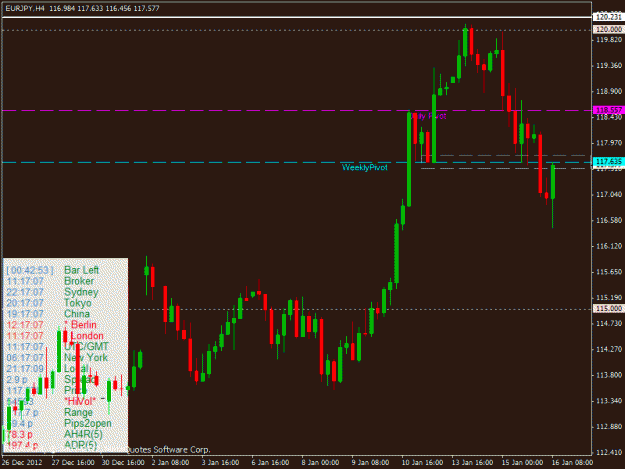
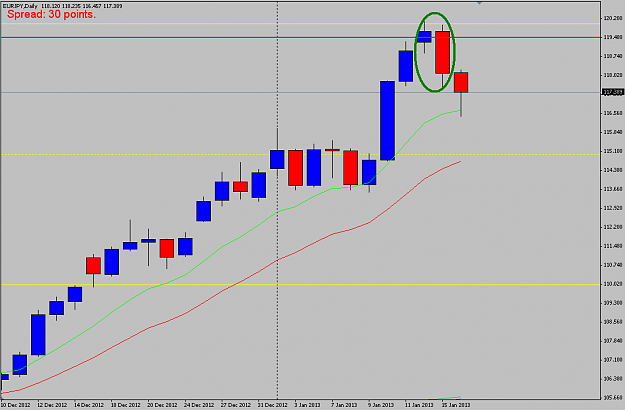
I'm currently in EURJPY, entering on 4h outsidebar at swing high, BRN 120. I already moved my stop to BE, looking for 115.8 to take profit. See chart attached.
Remember, we are not looking for a HCR or LCS on the current swing, we are looking for a previous Swing Point.
Hope they help.
I know it can sound very confusing at first.
Set your CHF/JPY chart up with the same levels and watch what happens at this level.
Try and find a Monthly & Weekly Level that are the same level or, a Weekly & Daily level.
Ignored
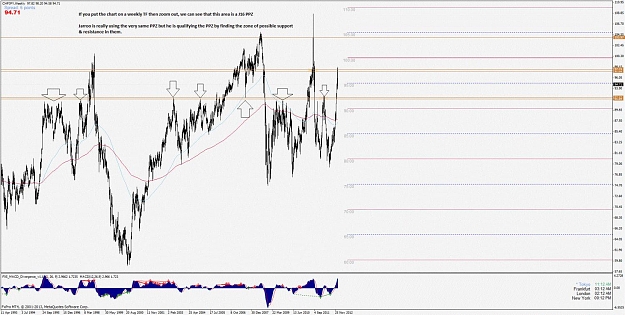
thanks for the explanation and charts buddy its really good of you.. those monthly's really effect things dont they
Hi, my first post here, even though I follow this thread for quite some time... Thank you for all the effort you invest in this...
I'm currently in EURJPY, entering on 4h outsidebar at swing high, BRN 120. I already moved my stop to BE, looking for 115.8 to take profit. See chart attached.
Ignored
I apologize in advance for my English
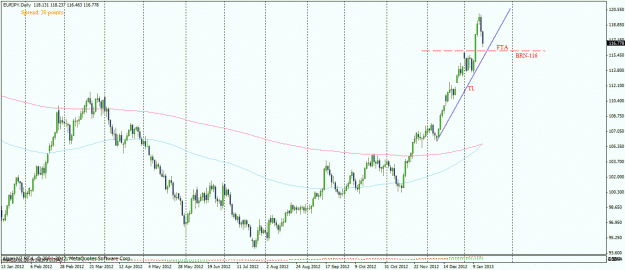
I also watched the pair, but the more I'm interested in the level of 116.
I want to observe the behavior of a price at this level. I want to see the signal PA.
As a beginner, I would like to know the thoughts of others in the group
Attached Image (click to enlarge)
It's only after we've lost everything that we're free to do anything.
I apologize in advance for my English
I also watched the pair, but the more I'm interested in the level of 116.
I want to observe the behavior of a price at this level. I want to see the signal PA.
As a beginner, I would like to know the thoughts of others in the group
Ignored
hi alexandr
that looks like the trade has had a nice run. just had a look at the 4 hr chart which shows a BUOB which is also a DBLHC unless something happens drastically in the next 40 minutes.
there seems to be a s/r zone around the weekly pivot as there are some bar highs/lows through this area. if this area breaks it may run back up again. if the area hold it could turn around and run back down again.
daily chart looks like it has the potential to form a pin bar that could indicate a run back up again.
depending on your trade management style might be worth locking in some profit above the zone around the weekly pivot.
maybe some of the senior guys will comment also. i'm just a beginner also
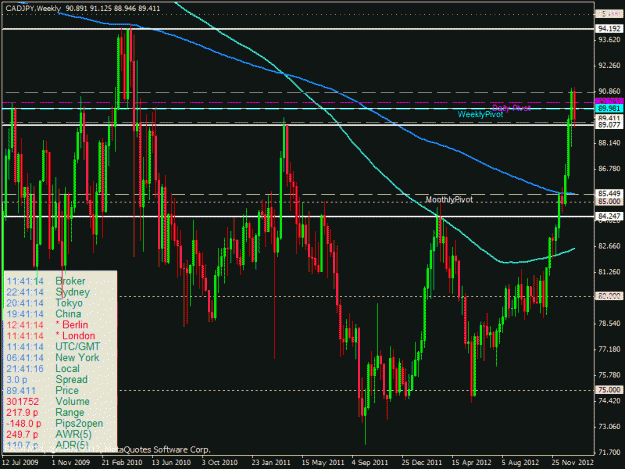
still working on getting my head around LCS and HCR. alot of the charts i am looking at seem to have a few different levels at which to draw the lines and depending on where you draw them seems to make the price tell a different story at these levels.
with the attached chart i am looking at the current price which coincides with a level i drew using the weekly chart. my question is depending on whether i draw the line closer to 89 or closer to 90 means that either the price breaks through and then retraces (using 89) or the price break above and then breaks back down (using 90).
price action on the daily chart has 3 bars with same high and then it breaks down. is this the clue i'm looking for as to where price might go?
can you give me some clarification as to how you guys see this.
that looks like the trade has had a nice run. just had a look at the 4 hr chart which shows a BUOB which is also a DBLHC unless something happens drastically in the next 40 minutes.
there seems to be a s/r zone around the weekly pivot as there are some bar highs/lows through this area. if this area breaks it may run back up again. if the area hold it could turn around and run back down again.
daily chart looks like it has the potential to form a pin bar that could indicate a run back up again.
depending on your trade management...
Ignored
Thanks hally
It's only after we've lost everything that we're free to do anything.
that looks like the trade has had a nice run. just had a look at the 4 hr chart which shows a BUOB which is also a DBLHC unless something happens drastically in the next 40 minutes.
there seems to be a s/r zone around the weekly pivot as there are some bar highs/lows through this area. if this area breaks it may run back up again. if the area hold it could turn around and run back down again.
daily chart looks like it has the potential to form a pin bar that could indicate a run back up again.
depending on your trade management...
Ignored
Hey there Hally,
My feeds show different on H4 (NY close candles), not a BUOB, but is rather going to be a PB alike form.
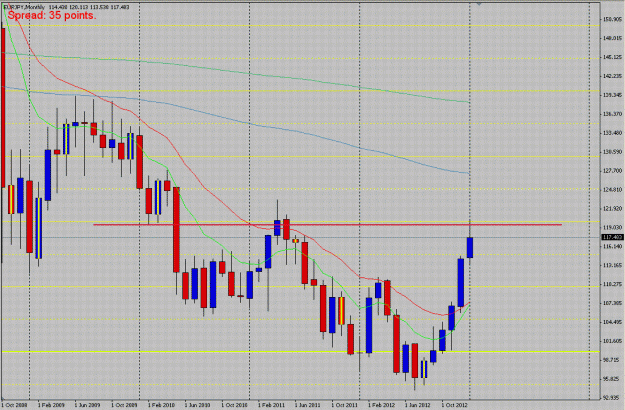
Also, I'd like to point out Monthly chart on EURJPY. check out BRN ppz and a close DBHLC on daily, triggered today.