DislikedHi all ;
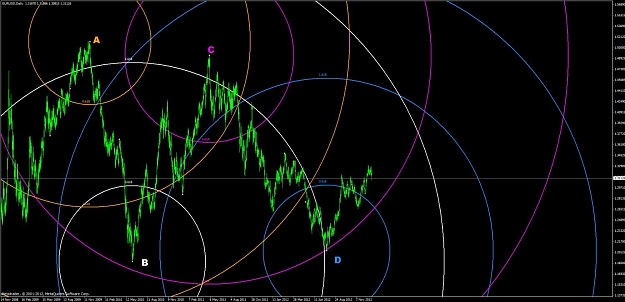
I like it when Bluemental posts things here , it smells knowledge and experience. Gann grids have always been difficult tools for me to draw , although ı forced myself afetr BlueMentals explanations , its still difficult. But I agree BlueMental that there are four different angles that the market respects , in order to detect those angles you really need to spend some time on ur drawings and seeing the right swings. I ll show the daily example of EURUSD , but on the other side ı shud confess that the angle changes in time ,...Ignored
But she does have her moments, If you can find watching paint dry exciting, then you can find her 'fast moving' angles (assuming the snails don't beat you to it).
Secondly, the Daily charts are not the place to find the angles, the angles are in there, but are far more difficult to find since there are relatively zero bars available to go through.
So try it on M30 or H1.
http://img145.imageshack.us/img145/3...1ganngrid1.png
How to find them is simple. Zoom out to max, and you imediately see the primary Grid angle. Draw a trend line from the Highest High to the Lowest Low. That is the Primary trend. To easily put your grid on this, follow these steps.
1. After choosing the Gann Grid tool, Click in the middle of your screen. Do not drag or try to put it anywhere, just click once. This will give you 3 'selection dots' on a single line. Drag one of the dots in any direction until you have a grid forming. It does not matter what the angle is, or where it is, as long as you can see the 'diamonds'.
The reason for the 'One click' method is because due to the expert coding, if you try to actually place your grid where you want it, it scales off the screen with only the starting point in the right place, and you can not reach it.
2. Now drag the Dot on the Grid that is at the Intersection, (not the single 'loose end' and drag it to the Low on the right side. The single 'loose' end, drag to the high. This 'sets' your angle. It does not have to be precise. Then open the Grid properties and copy whatever the scale is set to.
http://img534.imageshack.us/img534/4...1ganngrid2.png
3. Drag the single dot closer to the low, more or less keeping the angle, but how close is not important. Keep dragging it until the 'diamond' has formed the correct width of channel that is touching both sides of the prices.
4. Re-Open the Grid Properties and paste the scale that it was back there. The scale sets the angle. The bar width apart in the start and end of the grid sets the channel width.
5. By dragging the grid around the chart by the middle dot, you can now find where it fits best. If you want to 'reverse' the grid from the down angle to the up angle, just delete the '-' (The minus). Likewise if it is up and you want to make it down, just use - scale.
If you want to slightly change the angle for a better fit, it is easier to stretch it and use the centre line like a trend line. Rather than trying to 'small move' the tiny diamond. You know how to keep whatever angle you need (copy and paste scale. and the quick and easy way of channel width is just drag the dots to +- 5 or 6 bars apart. It doesn't matter what the diamond looks like, or what the angle. When you paste the scale, Bingo, the angle jumps into place.
Now how do you find the second 'secondary' line. Although she is a snail moving missionary only girl, it is actually easy to find her 'sweet spots'. This one I will give you with no words in picture form. When you are finished saying "Duh! How come I didn't think of that" You will never need to think again to find her (or any other girl's) sweet spot.
http://img211.imageshack.us/img211/2...1ganngrid4.png
As far as me saying this works easier on H1 than on D1, it was an outright lie, just so I could nag Missy Eur about how boring she is.
Proof? Look below.
http://img42.imageshack.us/img42/469...1ganngrid5.png
You want the same grid on a different timeframe?
Easy. In this case the scale (Red Grid following the trendline in above pic) is 184.60. Daily = 1440 minutes so 184/1440 *New Timeframe of your choice. (lets say H1) so *60 = 7.66
One way of getting the correct grids on the new timeframe is calculate them, and write them down. Delete both grids. Change Timeframes. Create 2 new grids with the calculated scales.
Another way is to use the Object Window. Specially if you are going from D1 to H1, because you will not find the start/end easily. Then you can calculate, put in the new scale and delete the grid. Close the Object Window, Create a new Grid and it will be the same colour an scale setting as the one you just deleted. Do the same for the other grid.