thats how you could combine fib and trend ... to create one hell of a chart that will generate you money ...
Ignored
Forexmnstr, I love that you are having a go. Well done. Let me correct you on one thing though. Your chart will not make you money - your ability to interpret your charts (and other things) may make you money.
Now you need to do several more things.
1) Try this structure on longer time frames 4H, daily, weekly to see if it tells you more.
2) Overlap your longer-term chart(s) with this chart to see if lines on one chart match up with lines on another. If a fib line on, say, a weekly chart lines up with different fib line on a 1H chart, and price touches this line at the same point where your trend line crosses it, this indicates a hot spot - a place where longer term traders and short term traders may both enter a trade. You want to be going with the order flow - entering trades at the same price and time with many other traders.
3) Back test it on old charts to see if it shows you consistent signals over time. Do you see hot spots, do you see places where price accelerated and moved 30 pips quickly? Does your chart signal potential entries or does it simply show you history?
Pay more attention to longer term charts as their signals are much more powerful than short term signals.
Can I also ask you to add daily, weekly and monthly pivots points to your chart to see if they show you more. For instance weekly pivot is at 1.3212 at the moment. Notice how price did not get much above there yesterday or today?
Also document these things so have a hard copy to refer to as these things get lost over time as you draw and re-draw charts.
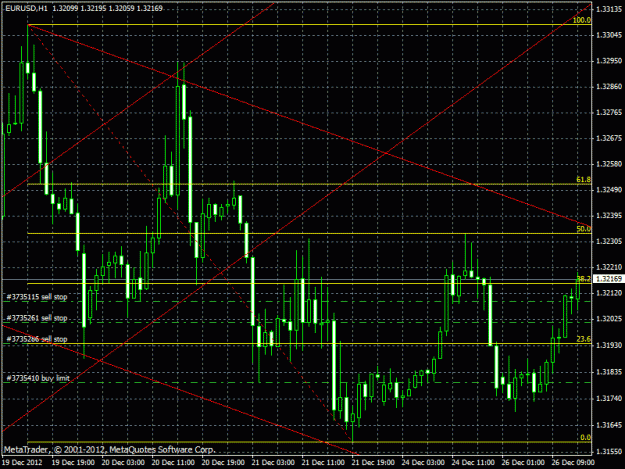
Forexmnstr, 1 more thing. If you draw that downward red trend line from 19 dec on a 4H chart, it will show you something better.
ie., draw it from the top of the 18 dec 12:00 candle across the 20 dec 12:00 candle.
then copy it to the bottom of the wick of the 19 dec 20:00 candle.
You now have a trend channel that price is tracking inside.
You should notice that price turned at 21 dec @ 16:00 to start going north for about 70 pips.
You could also draw a line down the middle of this channel and you will see that price is working above and below that line - pretty directionless at the moment.
Forexmnstr, 1 more thing. If you draw that downward red trend line from 19 dec on a 4H chart, it will show you something better.
ie., draw it from the top of the 18 dec 12:00 candle across the 20 dec 12:00 candle.
then copy it to the bottom of the wick of the 19 dec 20:00 candle.
You now have a trend channel that price is tracking inside.
You should notice that price turned at 21 dec @ 16:00 to start going north for about 70 pips.
You could also draw a line down the middle of this channel and you will see that price is working above and below...
Ignored
Thanks for the push mate ...
let the chart to be your chauffeur ... -Forexmnstr-
Draw the line that connects the most points, without impeding the candle bodies.
The theory; As someone mentioned earlier, everyone will draw the line differently but this line will include the MOST amount of those people.
this line will in turn have the most weight/ orders and become not only a strong support/resistance from limit orders but a liquid target that price "should" seek.
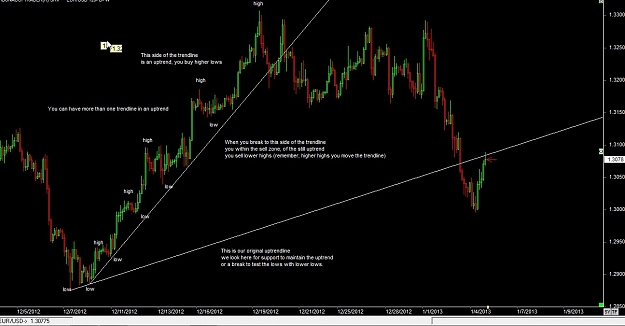
It's really quite simple, look for higher highs and higher lows on your charts and draw a line on the bottom connecting the low points and that would be an up trend. Don't trade short on an uptrend! I always wait for a breakout, when the price goes below the line and then go short until the trend changes or consolidates. If the price is making lower lows and lower highs, draw your line on top connecting the high points, thats a downtrend. Don't trade long! Wait for the breakout up then trade long. I always wait until about the third candle past the trendline along with other indicators saying the same thing before i jump in. Don't forget to check announcements or news before trading, this could throw off all technicals. Don't trade before an announcement!!
Well, there is no "correct" way to draw trend lines, as they are imaginary. However, I do like drawing some lines every once in a while.
I'll pick a top/bottom that is the most obvious. Then, I draw it out horizontally and then drop/raise it until it hits price. Then, sometimes, I'll go from THAT point, and do it again, and compare the angles.
Sometimes, I use not the tops/bottoms, but the highers opens/closes. Sometimes, I'll combine the two and check out convergences/divergences.
Trendlines are just another form of indicator, and like indicators - sometimes they work and sometimes they don't
That said - they can be very helpful in our analysis especially if they align with other forms of analysis at the same price level
If you are having trouble in deciding which price points to draw your trendline thro - why not bring up a line chart on your screen - this will get rid of the "noise" created by the bar/candle charts (bar /candle charts ARE important) and the major (or minor) pivot highs and lows are easily seen, so drawing your trendlines should be more obvious (depending on your trading style (time in the market))
Then revert back to your usual chart display and observe the price action at your trendline, hopefully they are now more meaningful
Once you have the tools - practice makes perfection
Again, depending on your trading style, if a trade picks up speed the angle of price movement will increase and thus deviate significantly from your trendline and if you wait for price to break your trendline - then you are going to give back a large part of your profit
To over come this - the current trendline is the line drawn from the most recent pivot low (for an uptrend) to the farthest away pivot low without passing thro any price action
...
Again, depending on your trading style, if a trade picks up speed the angle of price movement will increase and thus deviate significantly from your trendline and if you wait for price to break your trendline - then you are going to give back a large part of your profit To over come this - the current trendline is the line drawn from the most recent pivot low (for an uptrend) to the farthest away pivot low without passing thro any price action
Hope the above is of some help
Ignored
Can you provide a chart example of this?
Thanks in advance.
Hi Kokopelli
There is nothing new in what I stated, if the application is not logical to you - then it is not likely to prove profitable
I find it is best seen on strong trending markets.
I trade the daily charts and the strongest trends there tend to be the JPY pairs, the rest are primarily ranging markets (go to the lower timeframes to pick up their trends)
As an example of an accelerating trend (unsustainable) - look at say the USD.JPY - Looks like there is going to be some form of correction, soon?
That trend started around 10.10.12, try drawing a trend line thro the last pivot low (28.12.12) to that of 10.10.12 - it cuts right thro the previous price action!
The current trend line is that drawn thro the 28.12.12 and the pivot low of 21.12.12
Sometimes we get taken out early using this methodology - but thats the risk we take. More often than not, we get taken out near the end of the trend, without giving back a chunk of our profits.
If we are taken out early, we can always re-enter if we get another signal
Hope this helps.
Peter
PS I do not believe in posting charts - if you are really interested, then you do your own checking to make sure you really understand
Hi Kokopelli
There is nothing new in what I stated, if the application is not logical to you - then it is not likely to prove profitable
I find it is best seen on strong trending markets.
I trade the daily charts and the strongest trends there tend to be the JPY pairs, the rest are primarily ranging markets (go to the lower timeframes to pick up their trends)
As an example of an accelerating trend (unsustainable) - look at say the USD.JPY - Looks like there is going to be some form of correction, soon?
That trend started around 10.10.12,...
Ignored
To be honest, even I can't understand what you're saying. You're saying the "farthest away pivot" which would be the very first one, no? Do you mean the closest one? What's with not believe in posting charts? Don't think it can happen, or just too lazy?
If you don't want people to understand you, that's cool, but why post if you don't want people to understand you?
Btw, I massively disagree with you on your USDJPY analysis, using 10,10 as a point. If anything, I'd say the "trend" started October of 2011. However, if you want to go on the daily, then I'd use 9,13,2012 as a point.
Hi Kokopelli
...
Hope this helps.
Peter
PS I do not believe in posting charts - if you are really interested, then you do your own checking to make sure you really understand
Ignored
Well, we all have our crosses to bear...beliefs...quirks...psychosis
And I respect that.
I totally understand what you're writing now after re-reading your initial post.
Initially, when you wrote the word "pivot" - my thinking was this kind of pivot...And I thought to myself...damn, that's pretty out there. http://www.pivotpointcalculator.com/
After reading your reply with the U/J example, I got it. In your post, Pivot = lower highs (in a down trend), and higher lows (in an up trend).
In fact, I do the exact same thing. For example, when there's a parabolic up move, I would connect the last higher-low with a higher low prior to that last higher-low (and to as many previous higher lows with this same trend-line...if possible) and then extend that trend-line into the future. If I do this enough times, I'm basically connecting the higher lows...thus, creating a crude low-period EMA of some sort.
Further illustration can be found in the pictures posted in the two referenced threads. Part 1
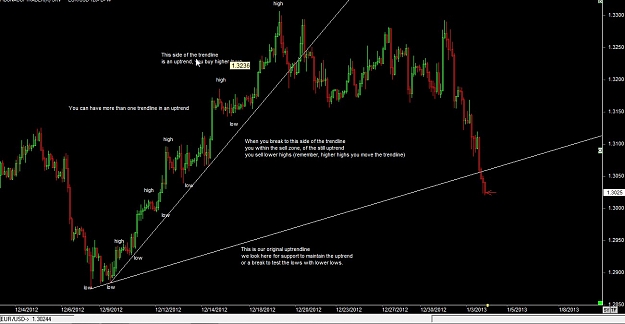
to be considered a low, the candle needs to be the lowest candle with two to the right that are higher, and two to the left that are higher
to be considered a high, the candle needs to the highest candle with two candles to the right that are lower, and two to the left that are lower
in an uptrend, to draw an uptrend you will need the low and a high, then a retracement (low) with a new higher high.
in an uptrend, each high will have a preceding low.
Connect only the low candles when a new higher high is made.
If you have a new low, and there has been no higher high...it is a break of the trendline, you do not move the trendline unless there is a new higher high.
Follow your rules. Do not cut thru any low candles, if a new high has been made. If a new high has been made then you adjust to that highs low, without cutting thru any previous candles. If you do cut through some candles, then adjust your trendline accordingly.
If the price action falls below the trendline, without having made a new higher high...let it break the trendline. You do not accomadate (moving the trendline) unless there is a new higher high.
Drawing a proper trendline is only one part of the equation. You need to be able to draw (or recognize) trendlines in varying timeframes. This is where you find your opportunities for a trade (of course using other methods too). An entry can be found where the smaller timeframe trend meets the larger timeframe trend. You look for support (resistance) from a trendline, or a break/resistance (break/support) from a trendline to determine which side of a trade to take.
After drawing a proper trendline, you have a few other options. Of course, you should never use only one form of chart analysis...combine it with other methods. What you will want to do is apply counter-trendlines. This is basically smaller timeframe trends running counter to the trendline you drew out. Sometimes you can do this on one chart, other times you will have to jump down to smaller timeframes in order to draw out a proper trendline. How do you know if you've got to drop down timeframes? If your highs/lows do not have two candles to the right...and two candles to the left. Because, if it doesn't, it isn't a high/low (you must drop down a timeframe or two). Remember also, in an uptrend you connect the preceding lows from each new higher high. If you have a low, where a higher high was not made...this is sideways movement...you do not include the lows in this area (see pictures in the previous posts quoted above).
Below is one of the same charts that I included in the other posts, only with update price action.
|
Joined Jul 2012
|
Status: *Time is my only friend*
|152 Posts
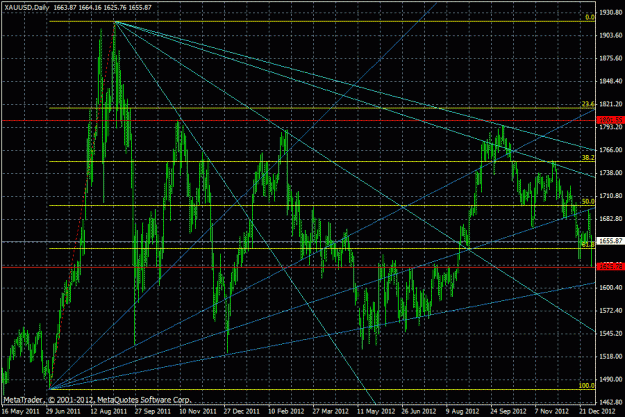
Trendlines are the best ... shows you the right S/R ... I have made alot of money because of trend line that I have figured S/R @ gold chart my order was to buy 5 lots @ 1627 ...
Attached Image (click to enlarge)
let the chart to be your chauffeur ... -Forexmnstr-
Trendlines are the best ... shows you the right S/R ... I have made alot of money because of trend line that I have figured S/R @ gold chart my order was to buy 5 lots @ 1627 ...
Ignored
ok...just asking an obvious question here...where is(are) the trendline(s) from your chart above that lead to your decision of 5 lots @ 1627?
ok...just asking an obvious question here...where is(are) the trendline(s) from your chart above that lead to your decision of 5 lots @ 1627?
Ignored
Check here ...forexmnstr I have drawn this chart week ago ... check the red line on 1625 also check the spot silver chart , but i did not place order to buy on silver ... I have placed the order on another platform ... I usually draw trends on MT4 demo account ...
let the chart to be your chauffeur ... -Forexmnstr-