Hello C,
One of your answers may negatively affect the performance of a touch entry methodology; so let’s go a bit deeper into the exercise by giving a sense of quality in terms of risk %, in addition, we can also add a confluence to 3 of the entries. Give it a try and I will elaborate the whys & don’ts of the 9 examples later on.
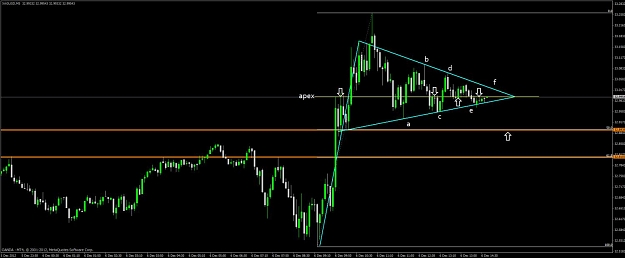
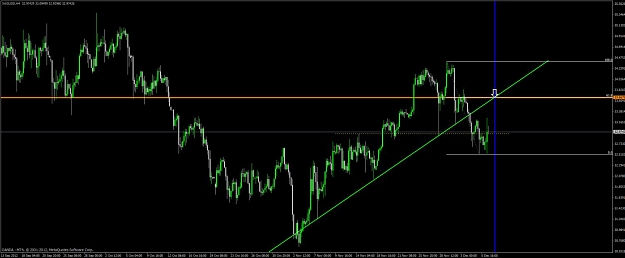
Reason 8 RBE (Rectangle Before Entry). This CAD/JPY setup was weak (reason why it didn't have trading levels) but it wasn't formed too close to the entry so a Rejection can be expected in this scenario. Keep in mind that Rectangles usually break in the direction of the trend (70% of the time), kind of a continuation pattern. It already tested UTL where it can be Rejected again to continue with a HH. SL will be place just above printed top.
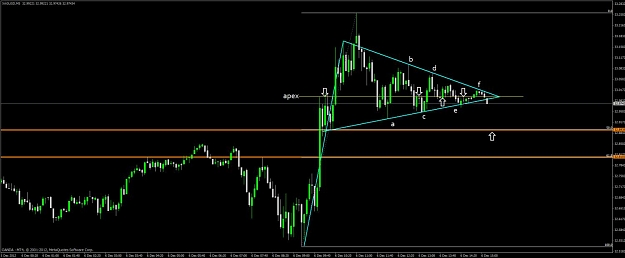
Reason 1 CTE (Clean Touch Entry). Observe that price didn't make any retracement before our entry, we can determin this by measuring the average candle move which was about its limit around confluence level.