3.put a horizontal line on all these levels and wait for Price action on these levels.
4. next day again note high,low and close of TUESDAY??
and...
Ignored
Hi Suraj,
Don't know if you're aware of that, but there are two different things:
1. mathematically calculated pivots:
this is what you're talking about.
If you come back to the early posts of this thread, calculated pivots have been used as area to monitor PA nearby.
Habbeeb used to post an indy that does the calculation for you, here it comes.
2. Price pivot zones, aka PPZ:
these are not calculated zones, and these are ZONES, not exact prices (well, beside Jarroo's "to the pip" (c) used on PTBCA/B).
They are area were price react, which shift from resistance to support or from support to resistance.
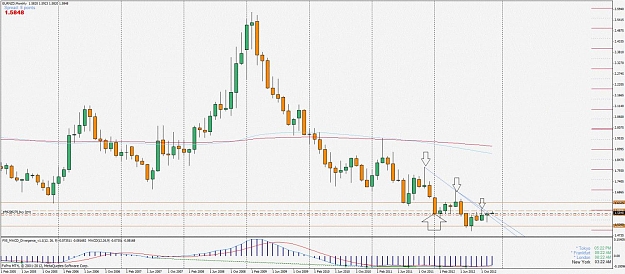
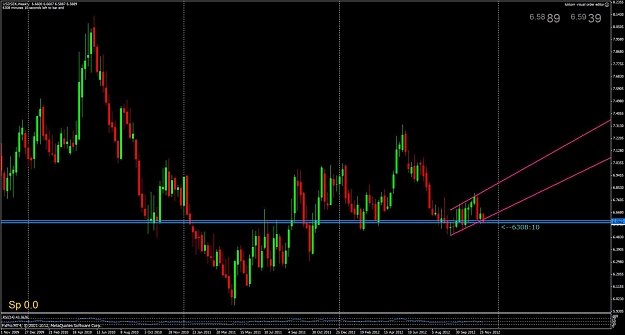
You can look at weekly charts to identify strong S/R area that could match RN/BRN, and then move to daily to assess price movement nearby these area.
but i am not sure about your trading style. Do you combine the supply/demand stuff with j16 material?
Ignored
Yes I do. I combine support resistance, bar and chart patterns with S&D. I mostly scalp M1 & M5 since I have a psychological problem holding onto trades and premature evacuation.
I am trying to develop more into swing trading off the higher time frames.
but i am not sure about your trading style. Do you combine the supply/demand stuff with j16 material?
Ignored
I was reading through Ken Lee's thread and noticed you were active on there for a while. Did you give up on trading S&D?
It's not so easy to make a profitable system out of it. The higher time frames can be tricky, hard to pin point the exact levels but the lower timeframes work beautifully.
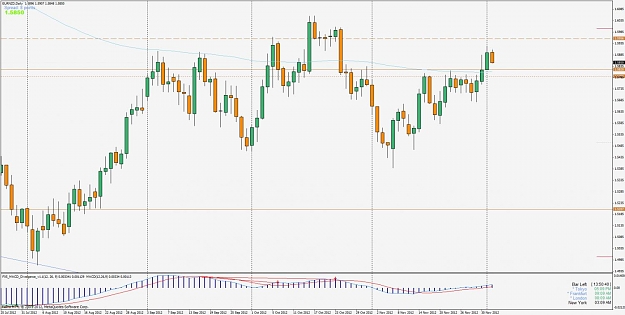
Here's one of my open scalp trades. Risk was 3 pips, took 6 and at BE. Anyway.. this is a bit off topic.
Don't know if you're aware of that, but there are two different things:
1. mathematically calculated pivots:
this is what you're talking about.
If you come back to the early posts of this thread, calculated pivots have been used as area to monitor PA nearby.
Habbeeb used to post an indy that does the calculation for you, here it comes.
2. Price pivot zones, aka PPZ:
these are not calculated zones, and these are ZONES, not exact prices (well, beside Jarroo's "to the pip" (c) used on PTBCA/B).
They are area were price...
Ignored
thanks for the detaild explaination and the indicator too!
well so you mean i shoulf be focusing on PivotPoint Zones? and wait for price action to happen! well PPZ is the one which all these traders use ovr here on thred or it is mathimatical one?
thanks!
Don't know if you're aware of that, but there are two different things:
1. mathematically calculated pivots:
this is what you're talking about.
If you come back to the early posts of this thread, calculated pivots have been used as area to monitor PA nearby.
Habbeeb used to post an indy that does the calculation for you, here it comes.
2. Price pivot zones, aka PPZ:
these are not calculated zones, and these are ZONES, not exact prices (well, beside Jarroo's "to the pip" (c) used on PTBCA/B).
They are area were price...
Ignored
I put it on my chart! So this is the Final solution for PIVOT POINT ZONES?
I dont need to look for anything els ryt?
thanks for the detaild explaination and the indicator too!
well so you mean i shoulf be focusing on PivotPoint Zones? and wait for price action to happen! well PPZ is the one which all these traders use ovr here on thred or it is mathimatical one?
thanks!
Ignored
Maybe I wasn't very clear:
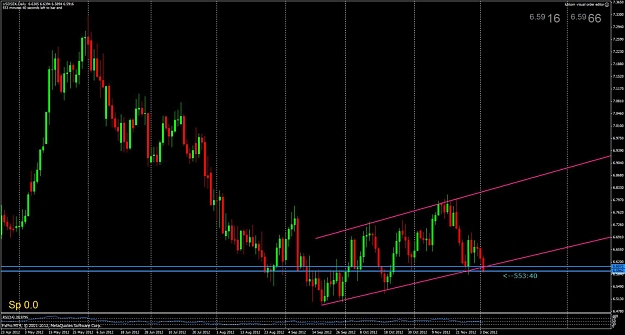
PPZ = price pivot zone, support <-> resistance transition, identified "by eye"
Price Pivot = mathematical calculation, exact price that changes every day (see the indicator).
PPZ are widely used in this thread. J16, and his followers, considers PPZ as area to monitor, because price is likely to change its behavior nearby PPZ. The idea is to wait for price to reach PPZ, and then wait for PA signal to develop nearby the PPZ to open a position in the direction shown by PA.
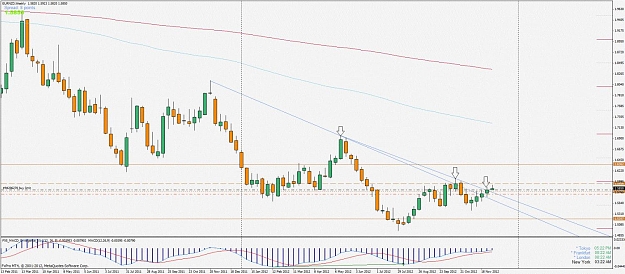
Example: price approaches from above (down trend) an area that has already been tested as both support and resistance. Price may either bounce back up, or break through.
If a bullish price action setup develops nearby the PPZ, it is likely that price would move up.
If it break through, then pulls back and a bearish PA setup forms at the PB, it is likely that price would move down.
The second option is to use calculated price pivot instead of PPZ.
Then the thought process remains the same: you wait for price action setup to develop at/nearby calculated price pivot.
So yes indeed, all you have to do is wait
One last thing. I wouldn't be waiting for daily PA setup to develop on daily calculated price pivots, since they change every day.
And since we, new to J16 and/or trading, are very encouraged to stick to daily / weekly TF, I would rather use PPZ instead of calculated price pivots. Just my opinion of course.
EDIT: Oups, sorry forgot to add that in any case James, Mike, and any other person here will strongly recommend to add confluence (location location location mantra) to price action. Check any senior member chart to further dig this question
Maybe I wasn't very clear:
PPZ = price pivot zone, support <-> resistance transition, identified "by eye"
Price Pivot = mathematical calculation, exact price that changes every day (see the indicator).
PPZ are widely used in this thread. J16, and his followers, considers PPZ as area to monitor, because price is likely to change its behavior nearby PPZ. The idea is to wait for price to reach PPZ, and then wait for PA signal to develop nearby the PPZ to open a position in the direction shown by PA.
Example: price approaches from above (down...
Ignored
thanks you made everything crystal clear!
do you use this indicator too!
i mean i can simply use this indicator as the total solution to find PPZ?
Yes I do. I combine support resistance, bar and chart patterns with S&D. I mostly scalp M1 & M5 since I have a psychological problem holding onto trades and premature evacuation.
I am trying to develop more into swing trading off the higher time frames.
Ignored
Hey C12, been trading since 2010, have read every page of this thread, took me several months! Traded 1m timeframes before discovering this thread, still do. I do incorporate the S/R, trendlines etc, along with of course candlestick set ups like are discussed here. Many people misunderstand small time frames thonk it's just noise, however you still see same patterns day in day out. If someone overtrades because of being on a small time frame it's a discipline issue, not the timeframe.