
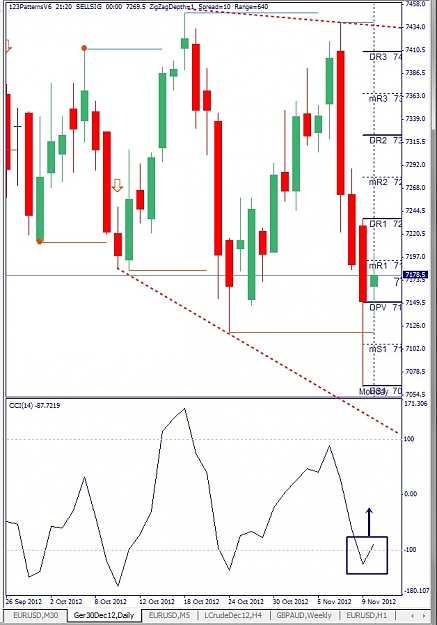
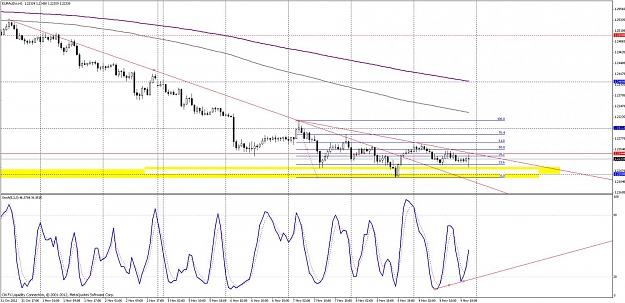
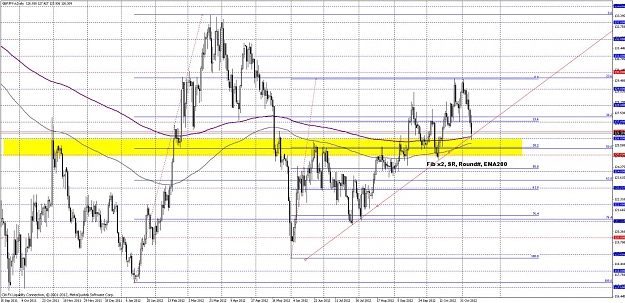
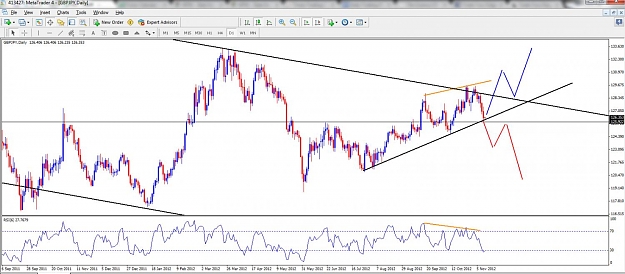
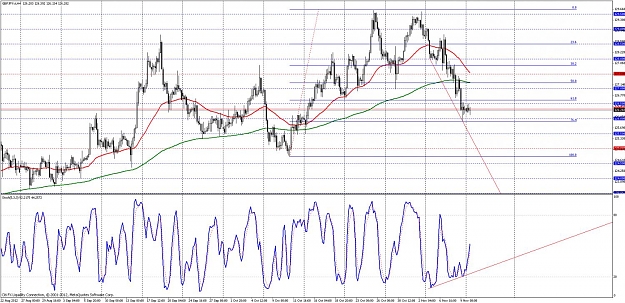
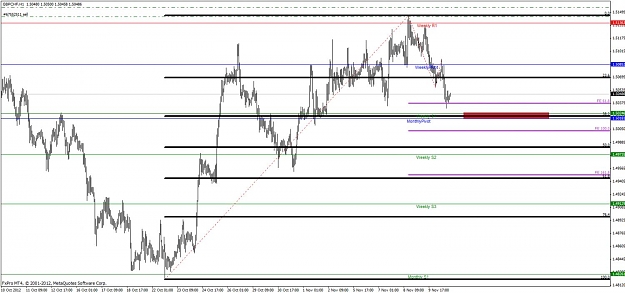
I just wanted to try a sell limit with a tight SL, which failed miserably. But I'm thinking re-entry using fibo on lower TF next week.
Trading is this Simple? Finally Explained simple and clearly! 46 replies
Trade Naked Candlesticks strategy 15 replies
Naked price trades 11 replies
Trading naked or keep it simple stuff.... 20 replies
DislikedI usually choose my SL based on either Standard Deviation of the trading TF or above/below certain S/R levels.Ignored
DislikedEURAUD long? --- fib 50, S/R, divergence on daily
If this is valid, how can I make an entry?
(1) It's already late -- can enter any time.
(2) A break of UTL on 1h
(3) Draw a fibo on 1h and wait for a good timing
or
(4) something else?
Thank you very much!l
Ignored
Dislikedhttp://www.tradeyouredge.com/wp-cont...Nov-GBPJPY.png
GBPJPY – Weekly chart attached. This set up is pretty similar to the EURJPY commentary on the 28th Oct. Price is currently at the bottom of a short-term upward trendline/channel (red). I would like a good short entry if price breaks below and re-test the trendline – making this a classic support turn resistance trendline.
Just to note, I do have a slight concern for this pair. On the larger timeframe, price actually made a higher lower – as shown where the purple...Ignored
DislikedJust my two cents...
I would stay away from GY for a while unless I get a strong sign (like a divergence)... It is too congested -- I believe this is what Saxon calls no trade zone... (actually I'm watching the PA for long...)Ignored
DislikedHi Forexgogo,
Thanks for the feedback.
Yes, there was divergence (RSI 6) but the trade was during the double top around 2 Nov. You're absolutely right about the congestion zone, which is why I'll need PA to break below the zone/triangle before going short (red). If not, I would want a strong break above the triangle before going long (blue).
As always, price can go either way, so will wait for PA before taking the trade. If neither happens, there's always another pair to trade
Anyway, let me know your thoughts.Ignored
DislikedStandard Deviation of the trading TF?
No idea what's that.
Either way, thank you for sharing.Ignored
DislikedI don't take a position in GY now simply because I don't know which way it's going. Probably I will wait until it hits 125.00 and turns to north (the red line on your chart)Ignored
DislikedStandard Deviation (SD) is a measure of variability or in the case of price ,volatility. You need to adjust your SL and position size based on volatility of the market in order to have the same % of risk for every trade and at the same time not being stopped out for minor price fluctuation. MT4 has an indicator for SD which works just fine, go to> insert>indicator>trend>standard deviation. The number changes for each TF which makes sense as each TF has its own SD, and it can be used to calculate SL.Ignored