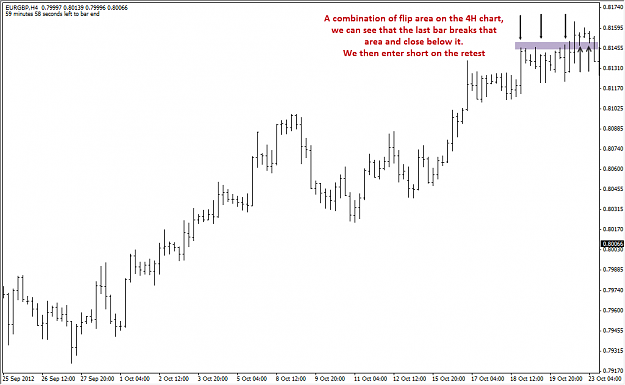
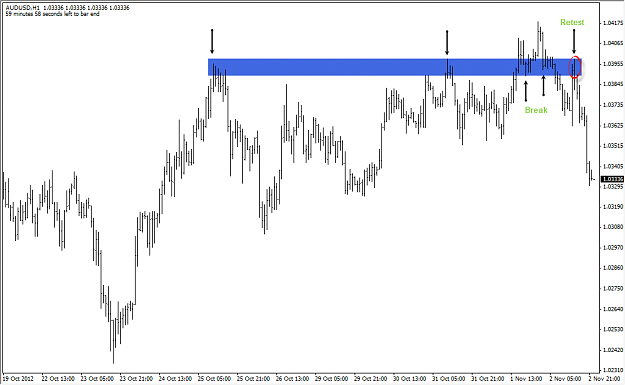
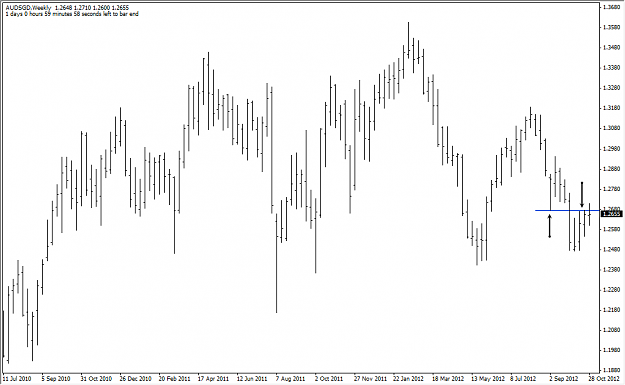
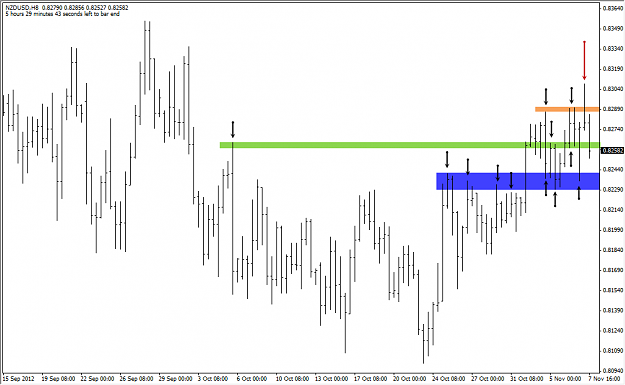
A break of flip between support and resistance areas, the higher the time frame, the better.
For inter-day trades I use the 1H & 4H charts.
For swing trades I use daily and weekly charts.
I first wait in order to see that the flip area was indeed broken, if that's the case, I enter on the retest to that area.
Those flip areas are an aggregate of bar lows and highs.
Here is an example:
Attached Image (click to enlarge)
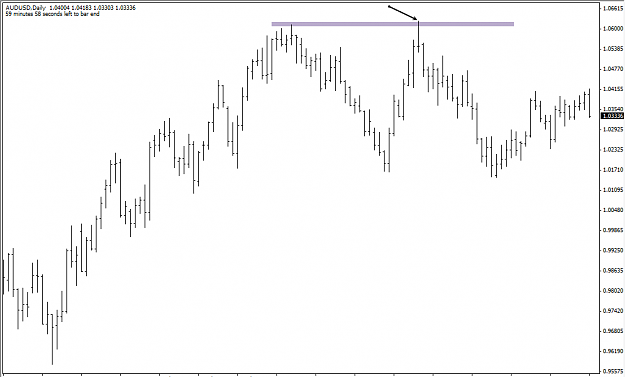
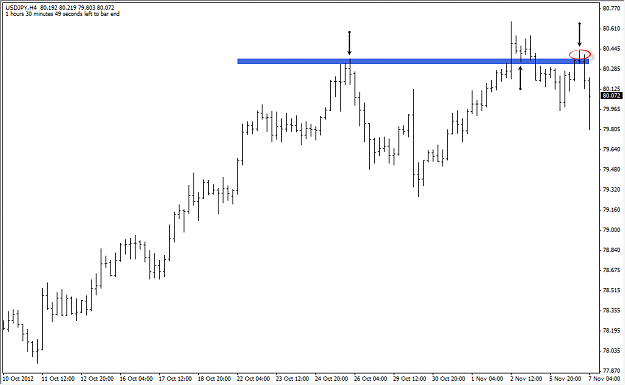
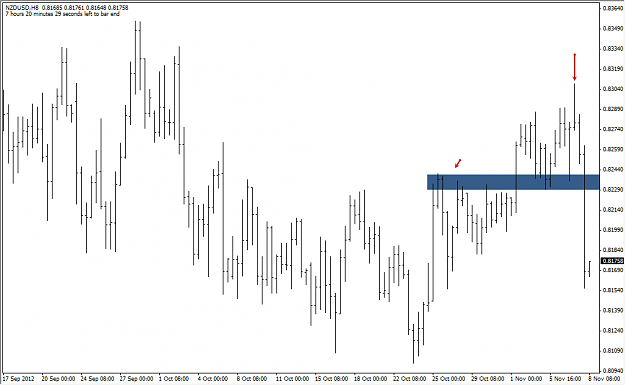
Here is the retest (price had retest that area twice, so in fact we had two opportunities going short):
Attached Image (click to enlarge)
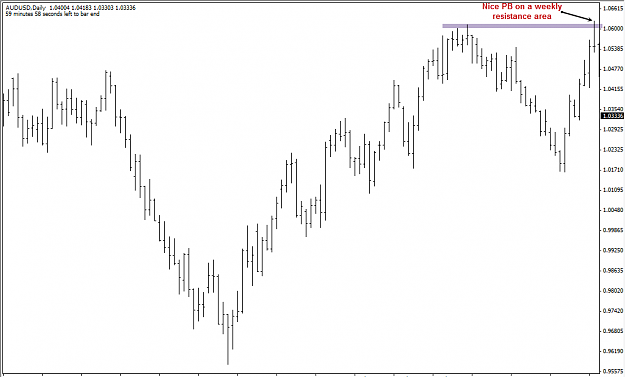
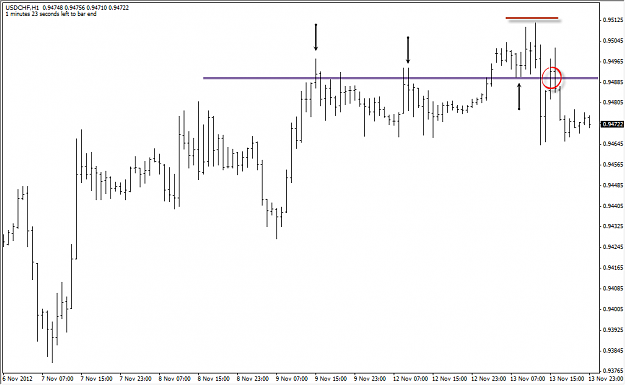
A break of a candlestick pattern called a PB. you will see and read in other places it's also being called as Inverted Hammer or a Pinocchio bar, but the meaning from the price action point of view is the same. you can Google and read about this pattern.
I must add that the pattern must occur on a resistance or support area in order for me personally to trade it.
Here is a nice example for a PB on the daily chart with a great location on a weekly resistance level
Remember, we are going short only after the pattern will be broken:
Attached Image (click to enlarge)
Here is where we are today, you can see that this move gained us a nice ROI to our account.
Wishing good luck with your journal. I would like to see more on this way of thinking like for example where do you take your profits or how do you decide which setups to take and which not.
I have tried this king of trading lately with very little success and I think it has to do with the mindset (the having courage part). I have passed many setups like the one you presented just to watch them produce a ton of pips, and then I took the lesser quality setups just to see the pips burned.
|
Joined Feb 2012
|
Status: USDILS Trader-to-be!
|35 Posts
Shalom, Naked Trader. Ma nishma?
Thank you very much for this wonderfully simple approach. I, and I believe many beginners like myself, would benefit big time from that. Please do keep them coming.
Do you use this strategy for all currencies? Does it tend to perform better with certain pairs than others?
I have printed it and pinned it on my wall. Will certainly look for that situation to occur in the future. In fact, that would be the first "strategy" I ever follow.
I am interested in knowing good resources for ILS analysis, in English would be amazing, but in Hebrew wouldn't be too bad, I still can try to understand it.
Have a wonderful day and please keep on your nice work. Peace and love from Egypt.
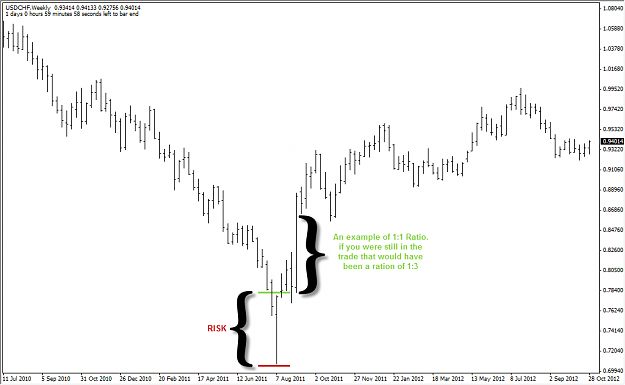
Since I had opened this journal in order to keep track of my performance, I had decided to try different approach with regards to SL & Exit methodology (more on exit methodology later on).
So, I have Two ways to place my initial SL:
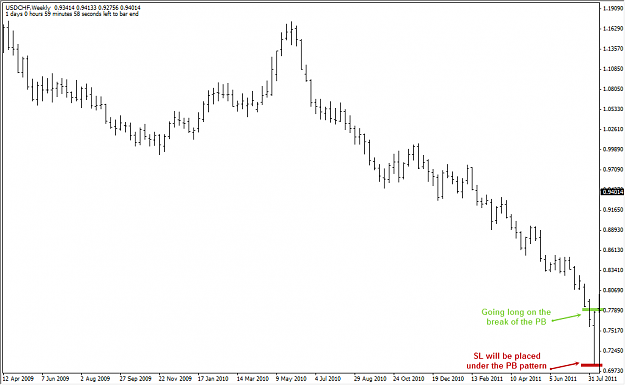
SL will be placed above maximum price / below minimum price (depending of course if we went long or short).
in a PB case the SL will be simply placed above / below the pattern.
Here is an example:
Attached Image (click to enlarge)
The main disadvantage with regards to placing the SL in that area is that we can sometimes have a big SL, meaning our ROI will be smaller.
On the other hand, in that scenario our SL will be safer thus will be hit fewer times.
We can see that even in the example above, we could have gained a nice ROI.
Attached Image (click to enlarge)
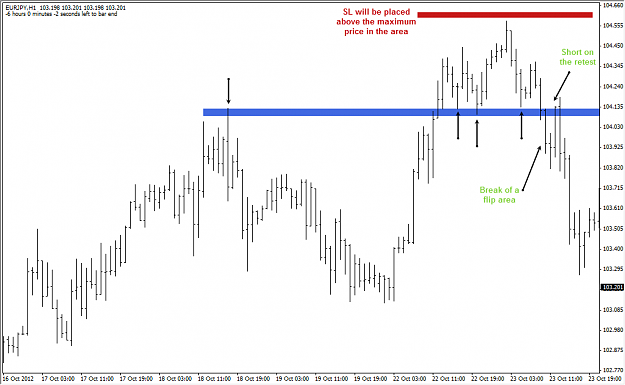
In a case of a break of flip between support and resistance areas, the same apply, we place the SL above maximum price / below minimum price.
Here is an example from the 1H chart:
Attached Image (click to enlarge)
SL will be hidden behind a lower time frame price movement
This will increase our ROI but will cause our SL to get hit more times.
I assume there is a balance between the two approach so will examine to see which work out better for me.
Wishing good luck with your journal. I would like to see more on this way of thinking like for example where do you take your profits or how do you decide which setups to take and which not.
I have tried this king of trading lately with very little success and I think it has to do with the mindset (the having courage part). I have passed many setups like the one you presented just to watch them produce a ton of pips, and then I took the lesser quality setups just to see the pips burned.
Ignored
Hey KMidas,
Thanks for your post, I really appreciate it.
It's nice to read that you had tried trading the same way, I think you are absolutely right, it's all in the mindset, this part was and still the most difficult part in my trading.
I think you can break it into Two parts:
How to choose the A+ trades? - we can relate this question to the fear factor.
When we are in the trade, how and where should we exit it?, how should we manage our SL movement? - we can relate this questions to the greed factor.
I think that 90% of being a trader is to struggle with the above points, the rest of the 10% is to just know what's working (price action) and what's not (indicators, robots, etc).
Thank you very much for this wonderfully simple approach. I, and I believe many beginners like myself, would benefit big time from that. Please do keep them coming.
Do you use this strategy for all currencies? Does it tend to perform better with certain pairs than others?
I have printed it and pinned it on my wall. Will certainly look for that situation to occur in the future. In fact, that would be the first "strategy" I ever follow.
I am interested in knowing good resources for ILS analysis, in English would...
Ignored
Shalom Kenawee,
Thank you for your kind words, it's truly warmed my heart and I appreciate it.
As for your questions, this strategy (price action) works not just with all currencies, but with all markets (futures, stocks, etc).
I think that any new trader should take the time and just learn the markets, learn what really moves them (supply and demand, round numbers, psychology, etc) and what's not (indicators, robots, Fibonacci, etc).
You will be amazed, but that's the easy part, after you blow a live account (or Two) you start to realize that something was wrong and you try different approach, that's what happened to me until I had found price action trading.
As for the USDILS, this pair has a very big spread (50 and above), I don't see any reason why trading it when you got 36 other pairs with a spread of 10 pips and below (not to mention other markets other than Forex).
I don't know any good resources (not even in Hebrew) for USDILS analysis, but I can promise you that you can do it by yourself in the future.
Just start learning and demo trading, that will built up your confidence.
If you can't be profitable in demo account, you won't be in a real account.
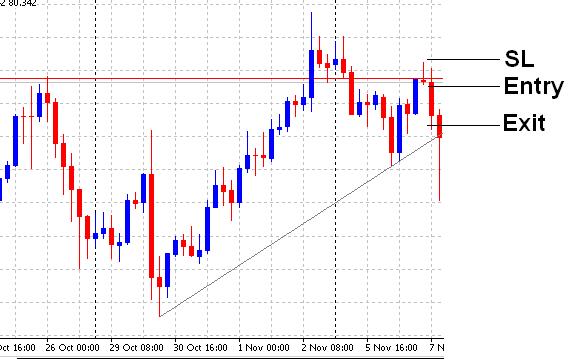
Did you go short, Yaniv? Where were your entry, exit, SL and TP?
I am just trying to get the hang of it. This (picture) is how I would have traded this (excuse me if it is naive or stupid, I am a beginner as you know)
But one thing I do not understand about that trade is that it would have been going against the uptrend. Isn't that an issue?
Let me know please how and why you traded this.
Thank you
Ignored
Hey Kenawee,
Your question is not stupid at all, please continue ask questions cause I learn from it a lot.
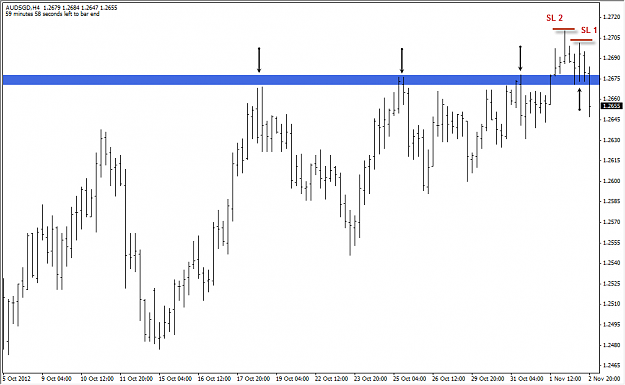
As for your question, I had attached your chart with addition data from my side.
Attached Image
After I saw there is a flip on the 4H, I had waiting for the hard break of that area, we got that break (I had marked it with a Green box).
After the break I had inserted the short order, waiting for price to retest that area (your Red line), we also call that kind of setup as "touch trade"
With regards to the SL, I'm checking Two placement of SL, I had marked them in the chart.
Since I had wanted to balance the account, in both cases I had closed after 1:1 (or +1% to the account).
I don't care about the trend, price (as you can see) respects most of the time support and resistance areas. but it's true that as a beginner we should try and trade with the trend and not against it.
I hope I had answered your question.
Please don't hesitate posting should you have any questions or unclear issues.
After I saw there is a flip on the 4H, I had waiting for the hard break of that area, we got that break (I had marked it with a Green box).
After the break I had inserted the short order, waiting for price to retest that area (your Red line), we also call that kind of setup as "touch trade"
With regards to the SL, I'm checking...
Ignored
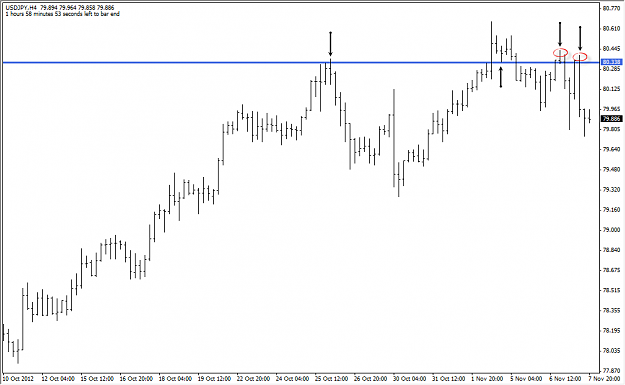
And look at that, price came to this level again and dropped hard time.
Attached Image (click to enlarge)
This thing works (as you can see), I like the first retest, retest that come after are more dangerous in my point of view.