hmmmmmmmmmmmmmmmmmmmmmmmmmn
kkkkkkkkkkkkkk
kkkkkkkkkkkkkk
Naked Chart Trading with Price Action 8 replies
Price Action, Indicators, Naked & Martingale Long Run 12 replies
Near-Naked Price Action Charts on the H4 and Daily TF! 199 replies
Naked trading using price action 0 replies
Price Action on Naked Daily Charts 13 replies
I first wait in order to see that the flip area was indeed broken, if that's the case, I enter on the retest to that area.
Those flip areas are an aggregate of bar lows and highs.
Here is an example:
Here is a nice example for a PB on the daily chart with a great location on a weekly resistance level
Remember, we are going short only after the pattern will be broken:
Here is an example:
I assume there is a balance between the two approach so will examine to see which work out better for me.
DislikedWishing good luck with your journal. I would like to see more on this way of thinking like for example where do you take your profits or how do you decide which setups to take and which not.
I have tried this king of trading lately with very little success and I think it has to do with the mindset (the having courage part). I have passed many setups like the one you presented just to watch them produce a ton of pips, and then I took the lesser quality setups just to see the pips burned.Ignored
I think that 90% of being a trader is to struggle with the above points, the rest of the 10% is to just know what's working (price action) and what's not (indicators, robots, etc).
Regards,
Yaniv
DislikedShalom, Naked Trader. Ma nishma?
Thank you very much for this wonderfully simple approach. I, and I believe many beginners like myself, would benefit big time from that. Please do keep them coming.
Do you use this strategy for all currencies? Does it tend to perform better with certain pairs than others?
I have printed it and pinned it on my wall. Will certainly look for that situation to occur in the future. In fact, that would be the first "strategy" I ever follow.
I am interested in knowing good resources for ILS analysis, in English would...Ignored
DislikedPending order short on the AUDSGD.
We can see on the 4H chart a nice flip between support and resistance, last 4H candle breaks that area.
If you open the 1H chart you can see clearly a very hard break, price doesn't stall in that area, but breaks it.
Attachment
What's really beautiful in that situation is that all that happens in a much bigger resistance area.
Here is the Weekly chart:
Attachment
I got Two SL, according to the scenarios I'm checking (marked with Red).
I still hadn't explained my exit...Ignored
DislikedHey,
I took the retest after the break of the flip of the USDJPY.
I took profit after 1:1 in order to cover the lost of my last trade.
Attach is the chart.
Attachment
+1% to the account.
Almost BE in total.
Regards,
YanivIgnored

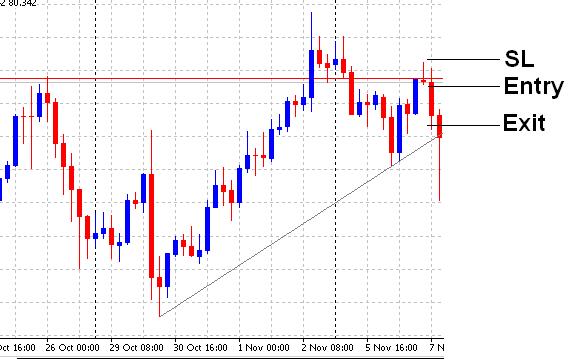
DislikedDid you go short, Yaniv? Where were your entry, exit, SL and TP?
I am just trying to get the hang of it. This (picture) is how I would have traded this (excuse me if it is naive or stupid, I am a beginner as you know)
But one thing I do not understand about that trade is that it would have been going against the uptrend. Isn't that an issue?
Let me know please how and why you traded this.
Thank youIgnored

DislikedHey Kenawee,
Your question is not stupid at all, please continue ask questions cause I learn from it a lot.
As for your question, I had attached your chart with addition data from my side.
Attachment
After I saw there is a flip on the 4H, I had waiting for the hard break of that area, we got that break (I had marked it with a Green box).
After the break I had inserted the short order, waiting for price to retest that area (your Red line), we also call that kind of setup as "touch trade"
With regards to the SL, I'm checking...Ignored
DislikedOK....... I took this 8H PB short on the NZDUSD during work hours, so can post it just now
Attachment
On the Orange area we got a false breakout of a resistance area on the 8H chart, this false breakout gave us a beautiful PB (Red arrow).
First area to watch is the Green area, we can see a combination of high and lows in the consolidation area.
The more bigger area is the Blue area, major flip of support and resistance.
My SL is now @ BE and I'm gonna TP @ the Blue area just at the low of the bar before the...Ignored
DislikedIt went down for over 800 pips! You are a prophet!
It looked like a "free fall" on my 4 hour-chart (I don't have 8 hours)
Great job, hopefully someday I will get half as good as you are.
Peace and love to you my friend.Ignored
DislikedHello Yaniv,
Nice journal!
Do you ever trade off W1 or D1 time frame?
AkiraIgnored